
Image source: Shutterstock
Highlights
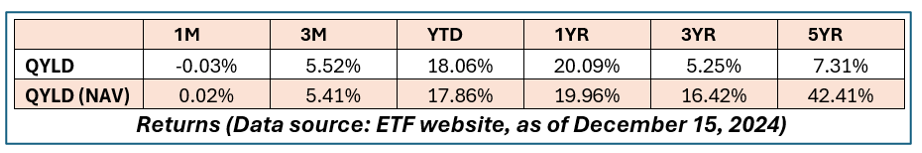
- QYLD offers exposure to the Nasdaq-100 while generating income through covered calls, with a return of 20.09% over the past year.
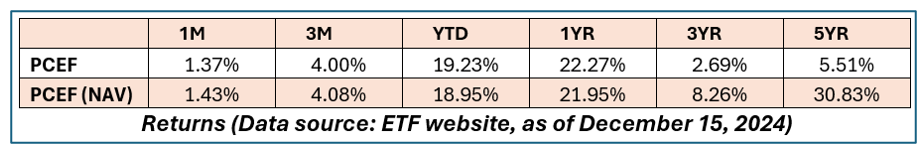
- PCEF targets a diversified portfolio of closed-end funds to generate high yields, delivering a 22.27% return in the past year.
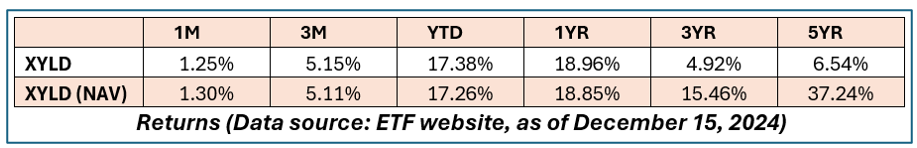
- XYLD tracks the S&P 500 and uses covered calls to provide consistent income, achieving an 18.96% return in the last year.
Exchange-traded funds (ETFs) have become a popular investment option due to their liquidity, flexibility, transparency, large fund size, relatively low fees and diversification benefits. These funds pool investors’ capital to invest in a basket of assets, such as equities, commodities or bonds, and trade on major stock exchanges. A key feature of ETFs is their ability to track specific indices or implement various strategies, such as income generation through covered calls or targeting specific sectors.
ETFs like the Global X NASDAQ 100 Covered Call ETF (QYLD), Invesco CEF Income Composite ETF (PCEF), and Global X S&P 500 Covered Call ETF (XYLD) have garnered attention for consistently delivering annual returns above 18%.
Global X NASDAQ 100 Covered Call ETF (NASDAQ: QYLD)
QYLD tracks an index that provides exposure to Nasdaq-100 stocks and sells call options on those stocks to collect premiums. The fund allows limited leverage.
QYLD has the highest exposure in the electronic technology and technology services, which comprise 34.19% and 33.45% of its portfolio, respectively. Notable holdings include Apple Inc., NVIDIA Corporation, Microsoft Corporation and Amazon.com, Inc.
- Inception Date: 12-12-2013
- Expense Ratio:61%
- AUM: USD 8.45B
- Index Tracked: Cboe NASDAQ-100 BuyWrite V2 Index
- Segment Benchmark: MSCI USA Large Cap
- Price/Earnings Ratio:76
- Price/Book Ratio:47
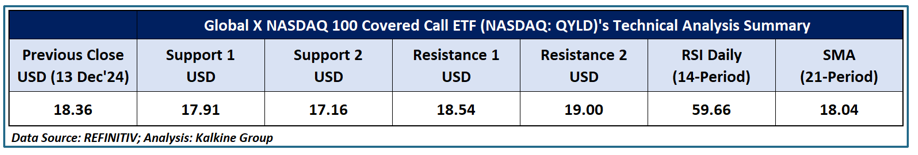
QYLD’s Technical Analysis:
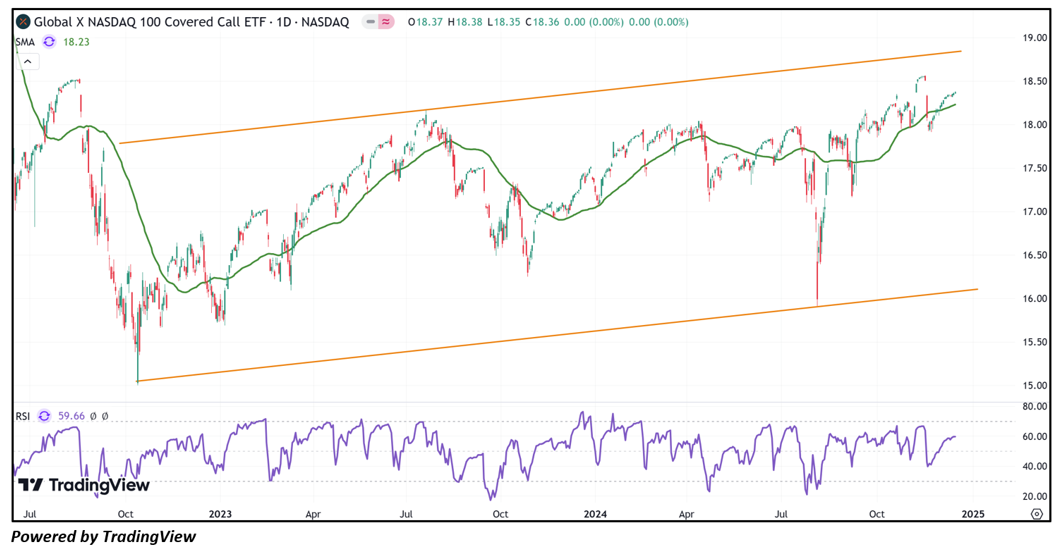
On the daily chart, QYLD's ETF price is establishing an uptrend characterized by higher highs and higher lows, indicating a positive bias. Additionally, the RSI (14-period) is trading above the midpoint, providing further support for the mentioned recommendation. Prices are trading above both the 21-period and 50-period SMAs, which may potentially function as dynamic support levels for the ETF; in contrast, the ETF’s most recent high might act as a resistance level. Crucial support for the ETF is positioned at USD 17.91, while key resistance is placed at USD 18.54.
Daily Technical Chart – QYLD
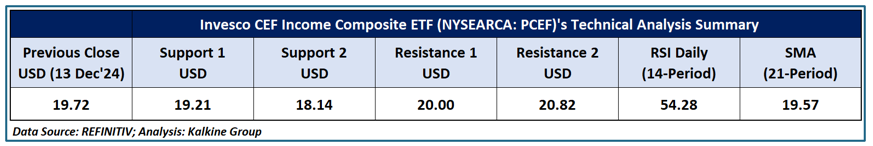
Invesco CEF Income Composite ETF (PCEF)
PCEF tracks an index of three types of yield-focused closed-end funds (CEFs): investment-grade fixed-income, high-yield fixed-income, and option-writing strategies.
The fund gives higher weight to larger CEFs and those trading at discounts. Unlike ETFs, CEFs are closed to new investments and often trade at discounts or premiums due to the lack of an arbitrage mechanism.
The fund is rebalanced and reconstituted on a quarterly basis.
- Issuer: Invesco
- Inception Date: 02/19/10
- Expense Ratio:08%
- AUM: USD 832.93M
- Index Tracked: SNET Composite Closed-End Fund Index
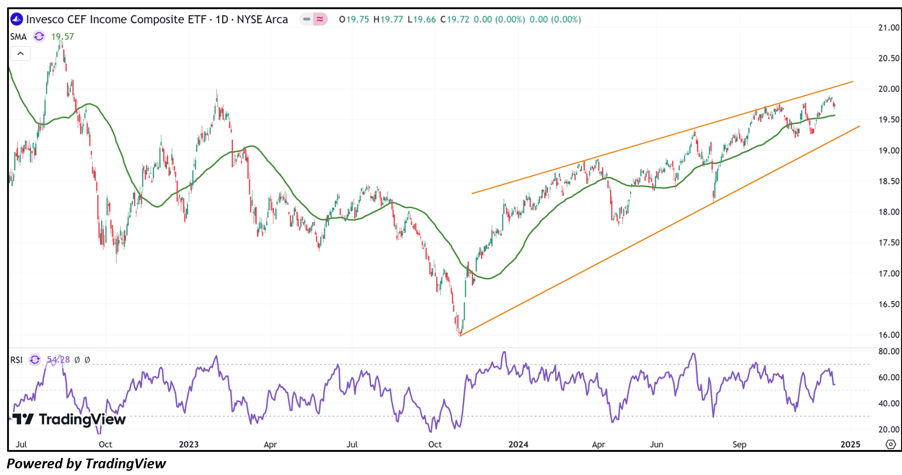
PCEF’s Technical Analysis:
On the daily chart, PCEF's ETF price is developing an ascending wedge pattern, suggesting that the current uptrend on the ETF might be halting. Additionally, the RSI (14-period) is establishing a top divergence in relations to price, providing further support for the previous analysis. Prices are trading above both the 21-period and 50-period SMAs, which may potentially function as dynamic support levels for the ETF; in contrast, the ETF’s most recent high might act as a resistance level. Critical support for the ETF is positioned at USD 19.21, while key resistance is placed at USD 20.00.
Daily Technical Chart – PCEF
Global X S&P 500 Covered Call ETF (XYLD)
XYLD tracks the S&P 500 and writes one-month, at-the-money call options on up to 100% of its holdings. This strategy generates income through option premiums but limits upside potential. By combining stock positions and option writing within an ETF, XYLD offers a more efficient way to access this income-focused approach, though its returns may differ significantly from the benchmark.
XYLD has the highest exposure to the electronic technology (22.58%) and technology services (21.26%). Notable holdings include Apple Inc., NVIDIA Corporation, Microsoft Corporation and Amazon.com, Inc.
- Issuer: Mirae Asset Global Investments Co., Ltd.
- Inception Date: 06/24/13
- Expense Ratio:60%
- AUM: USD 2.94B
- Index Tracked: Cboe S&P 500 BuyWrite Index
- Segment Benchmark: MSCI USA Large Cap
- Price/Earnings Ratio:57
- Price/Book Ratio:15
XYLD’s Technical Analysis:
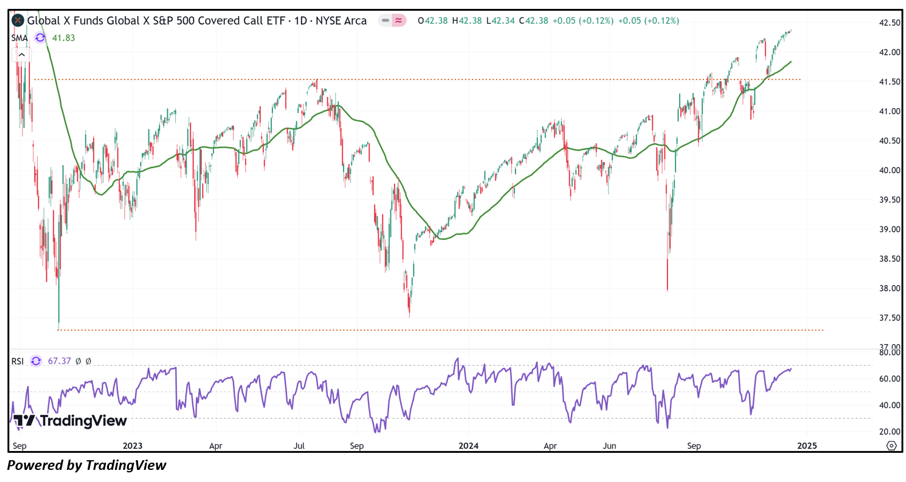
On the daily chart, XYLD's ETF price broke above a significant resistance established by its previous peak, signalling a positive trend. Additionally, the RSI (14-period) is trading above its midpoint, adding more evidence to the previous observation. Prices are trading above both the 21-period and 50-period SMAs, which may potentially function as dynamic support levels for the ETF; in contrast, the August 2022 high might act as a resistance level. Important support for the ETF is positioned at USD 41.54, while key resistance is placed at USD 42.95.
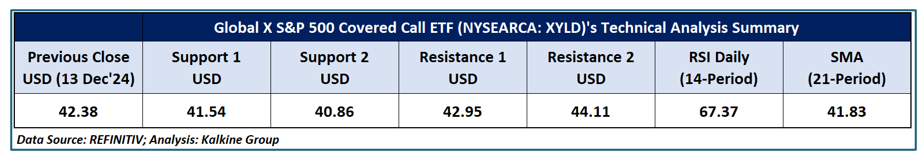
Daily Technical Chart – XYLD
ETFs like QYLD, PCEF, and XYLD offer investors unique strategies to access income generation and diversification, each catering to different risk appetites and investment goals. By utilizing covered calls and targeting specific sectors or indices, these funds enable investors to meet their investment goals while managing risk. With historical performance, low expense ratios, and a focus on high-demand sectors such as technology, these ETFs present compelling options for investors looking to enhance portfolio yield and achieve strategic growth.
As past performance is not a reliable indicator of future performance, investors should carefully consider their individual objectives and market conditions before investing.
Technical Indicators Defined: -
Support: A level at which the stock prices tend to find support if they are falling, and a downtrend may take a pause backed by demand or buying interest. Support 1 refers to the nearby support level for the stock and if the price breaches the level, then Support 2 may act as the crucial support level for the stock.
Resistance: A level at which the stock prices tend to find resistance when they are rising, and an uptrend may take a pause due to profit booking or selling interest. Resistance 1 refers to the nearby resistance level for the stock and if the price surpasses the level, then Resistance 2 may act as the crucial resistance level for the stock.


 Please wait processing your request...