
Key Highlights
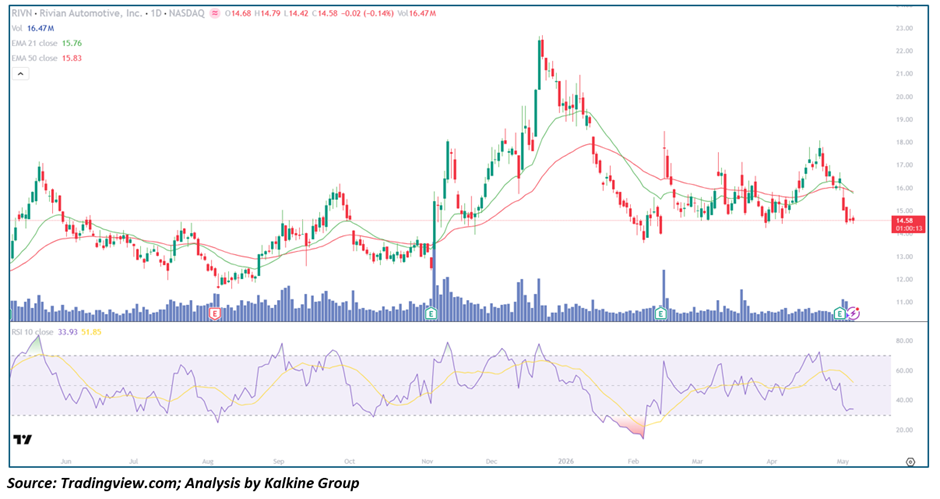
- Rivian Automotive, Inc. (Nasdaq: RIVN) is trading near $14.58, down marginally but reflecting a significant structural breakdown below key levels
• Price has decisively fallen below the 21-day EMA (~$15.76) and 50-day EMA (~$15.83), signaling a shift to bearish trend conditions
• RSI-10 at 33.93 is approaching oversold territory, indicating sharp momentum deterioration
• Volume at ~16.47M is elevated, pointing to strong institutional participation during the decline
• Price is testing the critical $14–$14.50 support zone, aligned with February 2026 base levels
Trend Structure: Bearish Continuation Threatening Base
RIVN is exhibiting a weakening structure, with the latest move undermining its prior recovery attempt.
Key observations include:
• Strong rally from ~$13 (Oct 2025) to ~$22–$23 (Nov 2025), followed by Reversal
• Sustained downtrend through early 2026, bottoming near $13.50–$14
• Failed recovery through March–April, now reversed sharply
This suggests:
• The broader trend remains bearish with a sequence of lower highs
• Recovery structure has been invalidated
• The $14 zone is the last key support before further downside
rice Action: Breakdown with Weak Close
Recent price action reflects strong selling pressure:
- Intraday range ($14.42–$14.79) with close near lows
• Breakdown from prior $15.50–$17 consolidation range
• Sharp ~17% decline from April highs near $17.50
This implies:
• $15.50–$16 zone has flipped to resistance
• Current price action reflects distribution, not consolidation
• Retest of February lows is increasingly likely
Moving Averages: Bearish Alignment Emerging
The Moving Average setup has deteriorated significantly:
- Price is well below EMA-21 (~$15.76) and EMA-50 (~$15.83)
• EMAs are converging, setting up a potential bearish Death Cross
• Prior flattening structure has reversed sharply
Interpretation:
• Short-term and medium-term trends have turned bearish
• EMA cluster now acts as strong resistance
• Any recovery must reclaim $15.75+ to regain stability
Momentum Indicators: Near Oversold Breakdown
RSI-10 at 33.93, smoothing at 51.85
Key signals:
• RSI nearing oversold levels, reflecting sharp selling pressure
• Large gap between RSI and smoothing average shows sudden momentum collapse
• Prior recovery momentum has been erased
Interpretation:
• Short-term bounce possible near oversold levels
• Broader momentum trend turning negative
• Sustained weakness likely if RSI falls below 30
Volume Analysis: High-Conviction Selling
Volume behavior confirms significance of the move:
- Elevated volume (~16.47M) aligns with major prior turning points
• Selling pressure dominant throughout session
• Institutional repositioning likely underway
This indicates:
• Breakdown carries strong conviction
• Not a routine pullback
• Follow-through selling risk remains elevated
Market Structure: Lower Highs Confirm Bearish Bias
The broader structure reflects continued weakness:
- Clear pattern of lower highs since November 2025
• Current move threatens to break February base
• No confirmed reversal structure in place
This suggests:
• Bearish trend remains dominant
• $14 zone is critical support
• Breakdown could open further downside
Key Technical Levels and Scenarios
Support Levels
• $14–$14.42 as immediate support
• $13.50 as major base support
• $12.50–$13 as deeper downside zone
Resistance Levels
• $15.76–$15.83 as EMA resistance
• $16.50–$17 as next resistance
• $18–$19 as major overhead resistance
Scenarios
- Stabilization (Primary Case)
• Price holds near $14 support
• RSI approaches oversold and stabilizes
• Consolidation forms near base
• Attempt to reclaim EMA zone - Continued Breakdown (Elevated Risk)
• Break below $14 and $13.50
• Death cross confirms bearish trend
• Downside toward $12.50–$13 - Recovery Bounce (Low Probability)
• Quick reclaim above $15.50–$15.75
• Short covering drives bounce
• Requires strong catalyst
Conclusion: Bearish Pressure Dominates at Critical Support
Rivian Automotive is under significant technical pressure following an Earnings-driven breakdown below key moving averages. The stock is now testing its February 2026 base near $14, with momentum weakening, volume elevated, and a bearish EMA setup emerging. While a short-term bounce is possible given near-oversold conditions, the broader structure remains bearish unless price can reclaim the $15.75–$15.85 EMA cluster. A confirmed break below $13.50 would signal further downside and reinforce the prevailing negative trend.


 Please wait processing your request...