
After bruising post-Earnings decline and a prolonged correction from $153 highs, Robinhood is staging a technical recovery — and the operating fundamentals are quietly rebuilding the case
Key Highlights
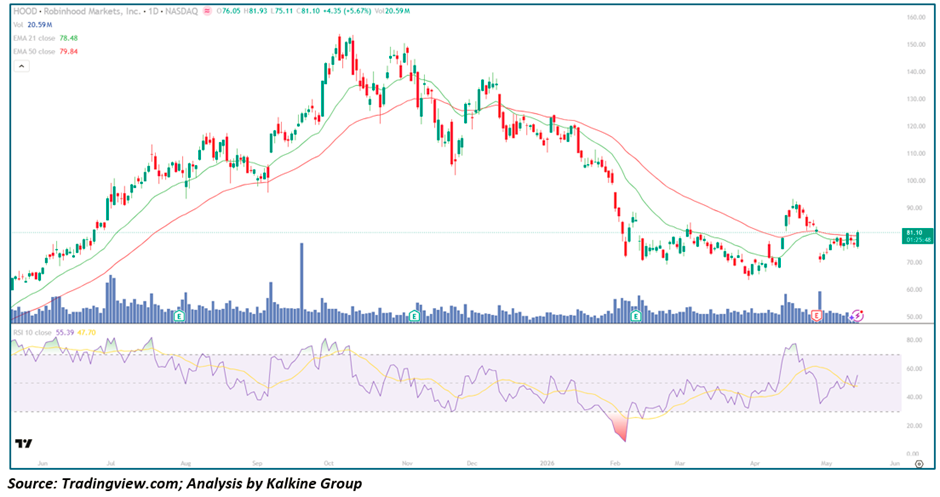
- Robinhood is trading at $81.10, up +$4.35 (+5.67%) on May 14, pushing back toward its key EMA resistance zone
- April 2026 operating data revealed total platform Assets of $345.4 billion — up 12% month-over-month and 49% year-over-year — with funded customers reaching 27.6 million
- Equity notional trading Volume surged 57% year-over-year to $248.5 billion in April, and net deposits of $6.0 billion maintained strong 20%+ annualised growth
- EMA-21 ($78.48) has been reclaimed, and EMA-50 ($79.84) is now being tested — a critical technical inflection point where a confirmed close above both EMAs would signal a structural trend Reversal
- RSI-10 at 55.39 sits in healthy neutral-to-bullish territory, with the signal line at 47.70 beginning to curl upward — ample momentum runway before overbought conditions
- Volume at 20.59M — above average — suggesting meaningful participation in the recovery move
- Wall Street consensus stands at Buy, with 19 analysts recommending the stock and an average 12-month price target of $108.27 — implying approximately 34% upside from current levels
Trend Structure: A Painful Correction Creates a Deep Value Entry
The HOOD chart over the past year is a tale of two acts. Act one was a spectacular bull run — from the $60s in mid-2025 to an all-time high of $153.86 in October 2025 — driven by a surge in retail trading activity, the crypto boom, and Robinhood's transformation from a single-product broker into a multi-asset financial platform. Both EMAs trended steeply higher during this phase, with price consistently trading above them and pulling back to use them as support before continuing higher.
Act two was the correction. From the October highs, HOOD entered a prolonged and punishing downtrend — shedding nearly 60% from peak to trough and bottoming near $57.68 in early 2026. The EMA-21 crossed below the EMA-50 — a Death Cross — and both began trending downward as the stock struggled to find buyers. A particularly sharp sell-off in February 2026 coincided with what the RSI registered as deeply oversold conditions, touching levels rarely seen in the stock's history — a reading visible as the pronounced RSI trough on the chart.
That oversold extreme marked the inflection point. From the February lows, HOOD has been quietly rebuilding — higher lows, stabilising volume, and a gradual EMA flattening that now sets up a potential golden cross. Today's move to $81.10 brings the stock directly into the critical EMA-21/EMA-50 convergence zone — the most important technical test in months.
The Catalysts: Operating Metrics Quietly Improving Despite Earnings Noise
April Operating Data: Platform Scaling Continues
The immediate catalyst for today's move was the release of April 2026 monthly operating data, which showed the platform's underlying Business continuing to scale impressively. Total platform assets reached $345.4 billion — up 12% in a single month and 49% year-over-year — reflecting strong market appreciation and continued net deposit inflows. Funded customers grew to 27.6 million, up approximately 110,000 month-over-month and 1.65 million year-over-year, demonstrating that Robinhood's customer Acquisition engine remains active and healthy.
Equity notional trading volume of $248.5 billion — up 15% month-over-month and 57% year-over-year — signals that the broader market rally and retail engagement are driving meaningful activity through the platform. Options contracts traded also grew, reinforcing the thesis that Robinhood's product Diversification is working as designed.
Q1 2026 Earnings: A Miss That Masked Structural Progress
The Q1 2026 earnings report on April 28 initially triggered a sharp 13-14% sell-off, as revenues of $1.07 billion and EPS of $0.38 missed Wall Street estimates of $1.17 billion and $0.41 respectively. Crypto notional trading volumes on the Robinhood app declined 48% year-over-year to $24 billion — the headline culprit for the miss.
However, beneath the surface, the structural story remained intact. Revenues still grew 15% year-over-year. Robinhood Gold subscribers hit a record 4.3 million — up 36% year-over-year — representing a high-Margin, recurring Revenue stream that was almost non-existent three years ago. Net deposits of $18 billion maintained a 22% annualised growth rate, and event contracts traded hit a record 8.8 billion. Management guided Q2 2026 EPS of $0.45 and revenue of $1.234 billion — a meaningful sequential acceleration that the sell-off appears to have underpriced.
Venture Fund Expansion and Private Markets Access
Robinhood is also quietly expanding its addressable market in ways that are not yet reflected in the stock price. The company opened its private markets platform to 150,000 retail investors and filed a confidential registration for RVII, its second venture fund — moves that position Robinhood as a gateway for retail investors into asset classes previously accessible only to institutions. This strategic expansion into private markets and venture represents a significant long-term revenue diversification that could reframe how analysts value the business.
The Great Wealth Transfer Tailwind
CEO Vlad Tenev has repeatedly highlighted that Robinhood is "entering the early innings of the Great Wealth Transfer" — the multi-decade intergenerational transfer of an estimated $68 trillion in assets from Baby Boomers to Millennials and Gen Z. Robinhood's demographic positioning — deeply embedded with younger investors through mobile-first, commission-free trading — makes it one of the most direct beneficiaries of this structural tailwind in the entire financial services industry.
Wall Street Constructive Despite Recent Cuts
Despite near-term price target reductions following the Q1 miss, the broader analyst community remains firmly constructive. With 19 Buy ratings against only 3 Sells, a consensus target of $108.27, and the most optimistic projection at $155 — representing nearly 100% upside — the Street's view is that the Q1 miss was cyclical rather than structural, and that Robinhood's platform diversification will drive a meaningful earnings re-acceleration through the remainder of 2026.
Moving Averages: The Critical EMA Test Is Now
The EMA configuration is at its most interesting juncture in months:
- EMA-21 ($78.48) — reclaimed on a closing basis; now acting as dynamic support
- EMA-50 ($79.84) — currently being tested from below; this is the key level to watch
The near-convergence of both EMAs — with EMA-21 approaching EMA-50 from below — sets up a potential golden cross signal in the coming sessions if price can hold above both. Historically, a golden cross following a prolonged downtrend, particularly one where RSI reached deeply oversold extremes, carries significant bullish implications for medium-term trend direction.
A confirmed daily close above $80 — with both EMAs cleared — would represent the clearest technical buy signal on the HOOD Daily Chart since the October 2025 highs. Pullbacks toward the $75–$78 zone would represent the highest-quality re-entry opportunities within the developing recovery structure.
Momentum &Amp; Volume: RSI Inflection from Historic Oversold
The RSI-10 at 55.39 tells a story of measured, sustainable recovery rather than momentum extremism — a marked contrast to the parabolic setups in WOLF or NBIS. The RSI bottomed at levels near 15–18 in February 2026, among the most extreme oversold readings in the stock's history, and has since been systematically climbing through 30, 40, 50 — each level a higher low confirming the underlying momentum shift.
The signal line at 47.70 beginning to curl upward, with the fast RSI now clearly above it, is a classic momentum crossover signal that historically precedes sustained directional moves. At 55.39, the RSI has meaningful room to extend toward 70+ before overbought conditions would Warrant caution — suggesting the current recovery is in its early to middle stages rather than nearing exhaustion.
Volume at 20.59M, while below recent peaks, represents above-average participation for the stock and is consistent with a genuine institutional recovery rather than thin-volume noise.
Key Technical Levels and Scenarios
Resistance Levels
- $79.84–$81.00 — EMA-50 and current price zone; critical near-term hurdle
- $90.00–$95.00 — Next meaningful resistance and first significant upside target
- $108–$110 — Consensus analyst price target zone; major resistance from 2025 price history
- $153.86 — All-time high; ultimate bull case target
Support Levels
- $78.48 — EMA-21 (immediate dynamic support; must hold on any pullback)
- $72–$75 — Prior consolidation zone; key structural support
- $63–$65 — Fibonacci Retracement support; the 61.8% level that contained the February lows
- $57.68 — 52-week low; absolute structural floor
Scenarios
- Bullish Continuation (Primary Case) — HOOD closes convincingly above the EMA-50 at $79.84, confirming a golden cross in coming sessions, and accelerates toward $90–$95 as Q2 earnings guidance of $1.234 billion revenue begins to look increasingly credible against strong April operating data.
- Consolidation (Secondary Case) — Stock oscillates in the $72–$85 range through summer as the market awaits Q2 results on August 5, building a higher base supported by the rising EMA structure while operating metrics continue to improve month by month.
- Bearish Rejection (Tail Case) — Failure to hold above the EMA-21 at $78.48 on a closing basis triggers a return to the $70–$72 support zone, particularly if broader market conditions deteriorate or crypto volumes Fail to recover — a scenario that would represent the most attractive accumulation opportunity for longer-term investors.
The Bear Case: Crypto Dependency and Margin Pressure
The risks are real. Crypto notional volumes on the Robinhood app declined 48% year-over-year in Q1 — a dramatic slowdown that directly impacted revenues and triggered the earnings miss. While Bitstamp volumes partially offset this through the acquired platform, Robinhood's revenue mix remains sensitive to crypto market sentiment in ways that can create sharp, unpredictable quarterly Volatility.
Adjusted operating expenses rose to $607 million in Q1, including $14 million in new initiatives, signalling that Robinhood continues to invest heavily in growth — compressing margins in the near term even as the Top Line expands. With a trailing P/E of approximately 34x, the stock is priced for growth delivery; any sequential deceleration risks multiple compression.
Conclusion: A Platform Business Unfairly Punished — and Beginning to Recover
Robinhood's correction from $153 to $57 was severe, arguably pricing in a permanent Impairment of the business model that simply does not reflect reality. The platform now manages $345.4 billion in assets for 27.6 million funded customers, generates $4.47 billion in annual revenue, posted $1.88 billion in Net Income for full year 2025, and is systematically diversifying from crypto dependency into options, event contracts, private markets, and Wealth Management.
The April operating data published this week confirms that the underlying platform continues to grow — customers, assets, deposits, and equity volumes all trending in the right direction. The Q1 miss was real, but the guidance for Q2 acceleration suggests the worst may be behind the stock. And with 23 Wall Street analysts carrying a Buy consensus and a target implying 34% upside, the fundamental backdrop for a recovery is more solid than the recent price action suggests.
Today's move back above the EMA-21 and into the EMA-50 resistance zone is the most significant technical development in months. A confirmed golden cross in the coming sessions — backed by continued improvement in monthly operating metrics — would mark the clearest signal that HOOD's recovery from its deep 2026 correction is transitioning from bounce to sustainable trend reversal.
The next major catalyst is August 5, 2026 — Q2 earnings — where management's guidance of $1.234 billion in revenue and $0.45 EPS will either validate or challenge the recovery thesis. Until then, the operating data released monthly provides a real-time scorecard for investors tracking whether the platform's growth engine is re-accelerating as expected.


 Please wait processing your request...