
Image source: Shutterstock
Highlights
- Scorpio Tankers’ Q3FY24 vessel revenue decreased by 8.0% YoY, primarily due to lower TCE revenue
- Net income for Q3FY24 rose 58.1% YoY, driven by reduced operating expenses
- Year-to-date net operating cash inflows grew 4.7% YoY, despite the negative impact of working capital
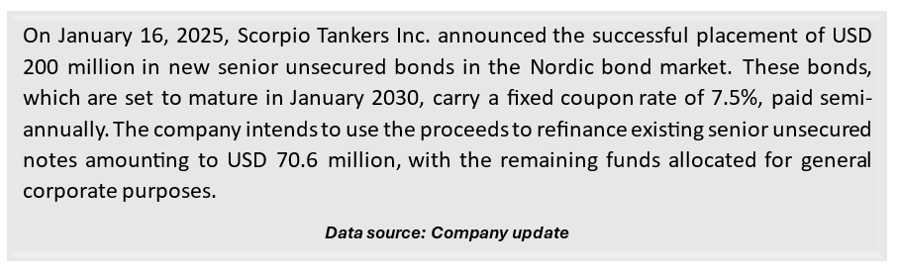
- Recently, Scorpio placed USD 200 million in new senior unsecured bonds
Scorpio Tankers Inc. (NYSE:STNG) is a Monaco-based company specializing in the transportation of refined petroleum products. It operates within the oil and maritime shipping sectors, focusing on the seaborne delivery of refined petroleum products to global markets.
For the third quarter of financial year 2024 (Q3FY24), Scorpio Tankers reported vessel revenue of USD 268.0 million, a decrease of 8.0% YoY compared to USD 291.2 million in Q3FY23. This decline was primarily driven by a reduction in TCE revenue, which fell to USD 258.2 million from USD 289.2 million in the prior year.
Net income for the quarter increased by 58.1% YoY, from USD 100.4 million in Q3FY23 to USD 158.7 million in Q3FY24, mainly due to lower operating expenses, though partially offset by decreased vessel revenue.
Year-to-date net operating cash inflows increased by 4.7% YoY, reaching USD 711.9 million compared to USD 679.7 million last year, driven by higher income despite the unfavourable impact of net working capital. Meanwhile, total cash and cash equivalents decreased by 43.5%, from USD 355.6 million in Q3FY23 to USD 201.0 million in Q3FY24, primarily due to cash outflows from financing activities, although partially offset by inflows from operating and investing activities.
Recent Business Update
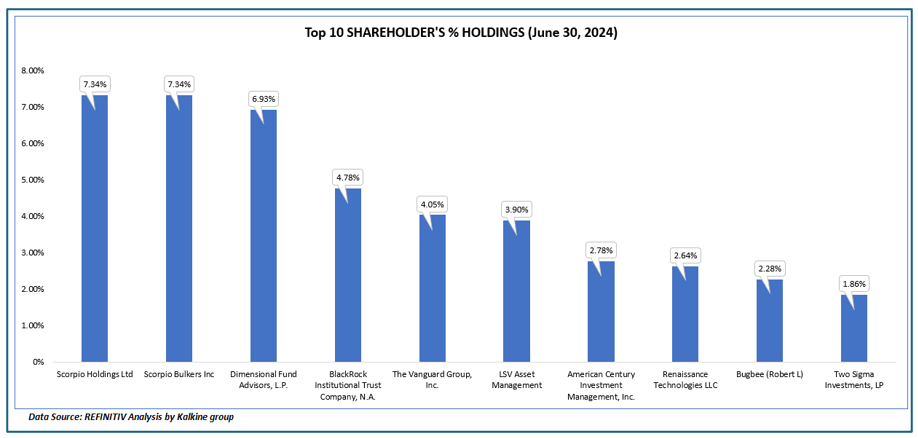
Top 10 Shareholders
The top 10 shareholders of STNG collectively hold around 43.88% of the total shares, indicating a concentrated ownership structure. The largest stakeholders are Scorpio Holdings Ltd and Scorpio Bulkers Inc., each owning a 7.34% stake in the company.
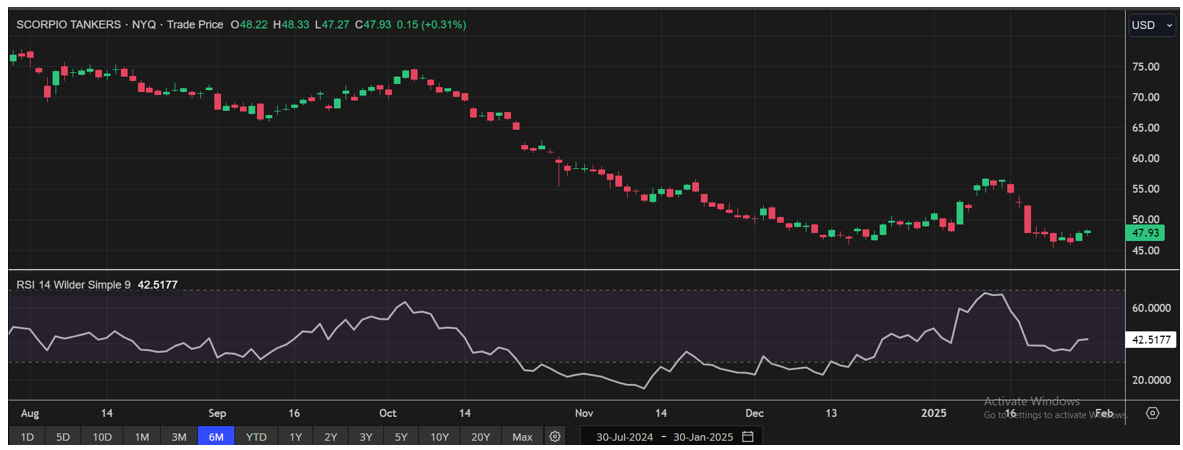
Stock Performance
The stock has experienced a correction of 17.74% over the past three months, with a more significant decline of 37.33% in the past six months. Currently, it is trading near the upper end of its 52-week range, which spans from a low of USD 45.43 to a high of USD 84.67. As of Jan 30, 2025, the stock closed at USD 47.93.
Note 1: Past performance is not a reliable indicator of future performance.
Note 2: The reference date for all price data, currency, technical indicators, support, and resistance levels is January 30, 2025. The reference data in this report has been partly sourced from EODHD/Others.


 Please wait processing your request...