
Key Highlights
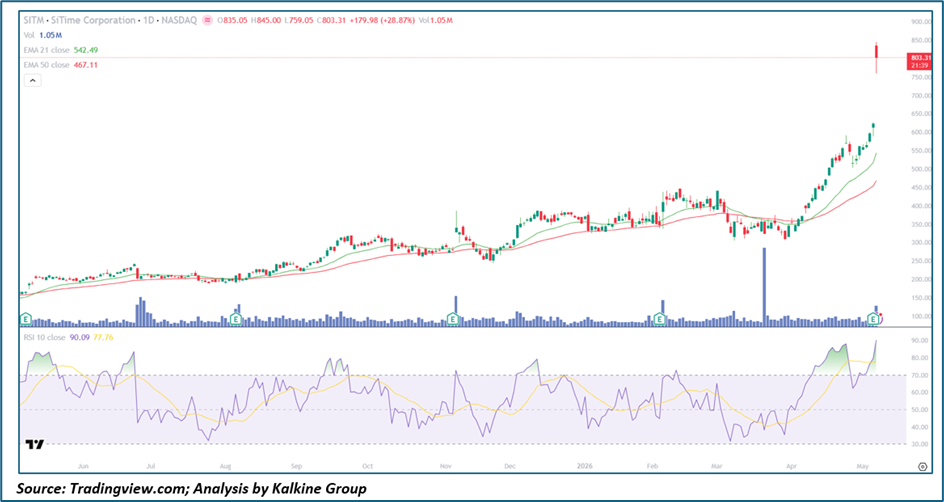
- SiTime (Nasdaq: SITM) surges +28.87% to $803.31 on Volume of 1.05M, spiking to an all-time high of $845.00 intraday following what is clearly a Blowout Earnings catalyst
- Price has launched into uncharted territory, trading approximately $261 above the 21-day EMA ($542.49) and $336 above the 50-day EMA ($467.11) — the widest gap from moving averages seen in the entire twelve-month trend
- RSI-10 at 90.09 — the most extreme overbought reading on this chart — with smoothing average at 77.76, signaling maximum short-term momentum but also heightened risk of near-term mean reversion
- Volume at 1.05M is the highest single-day reading in several months, confirming institutional conviction and genuine Demand behind the breakout
- Structure shows a sustained multi-month uptrend from June 2025 lows near $150, with today's move extending total appreciation to over 430% — one of the most powerful earnings-driven breakouts in the semiconductor space
Trend Structure: Trend Acceleration into Parabolic Phase
SITM has been in a well-defined and consistently rising uptrend since June 2025, with price steadily climbing from the $150 zone through a series of higher highs and higher lows. The trend was orderly and controlled through most of the period — price hugged the EMA-21 closely with brief pullbacks to the EMA-50 serving as re-entry opportunities. However, the trend character shifted dramatically beginning in March–April 2026, when price began accelerating sharply to the upside, and today's earnings-driven explosion to $845 has pushed the trend firmly into a parabolic phase. While parabolic moves can extend far beyond what seems reasonable, they also carry the highest risk of sharp mean reversion, and SITM's current structure demands respect for both the power of the move and the vulnerability that comes with such extreme extension from the moving averages.
Price Action: Historic Single-Session Earnings Gap
Today's price action is extraordinary by any measure — a $179.98 single-session gain representing a +28.87% move that has vaulted SITM to all-time highs above $845 before some intraday profit-taking brought the close to $803.31. The gap from the prior close near $623 to today's open at $835 is a testament to the magnitude of the earnings surprise. The intraday pullback from $845 to $803 — a $42 Retracement — suggests some near-term Supply is present at the highs, but the stock is still holding the vast majority of its gap gains heading into the close. Prior earnings gaps in this stock — visible at the E markers in June, August, November 2025, and February 2026 — each resulted in sustained follow-through over subsequent sessions, providing a constructive historical precedent for today's move.
Moving Averages: Extreme Extension, Structural Bullishness Intact
The Moving Average picture for SITM is one of extreme extension rather than structural concern. Price at $803.31 sits nearly 50% above the EMA-21 ($542.49) and 72% above the EMA-50 ($467.11) — an unprecedented gap in the context of this chart. Both moving averages are trending steeply upward and will accelerate higher in coming sessions as they incorporate today's explosive price data. While the gap between price and EMAs is not sustainable in the short term and virtually guarantees some form of consolidation or pullback, the underlying moving average trend structure remains powerfully bullish. The $542–$550 EMA-21 zone now represents the key medium-term support reference, though any pullback of that magnitude would represent a 32% retracement from current levels.
Momentum Indicators: Maximum Overbought — Handle with Care
RSI-10 at 90.09 is the highest reading seen on this chart over the past twelve months, surpassing even the prior overbought peaks in July 2025 and April 2026 that each preceded meaningful pullbacks. The smoothing average at 77.76 — itself deeply overbought — sits below the RSI line, confirming that momentum expanded rapidly and is at a historically extreme level. In prior instances where RSI reached the 80+ zone on this chart, a cooling period of one to three weeks typically followed before the next leg higher. The current reading of 90 represents maximum near-term momentum risk, and traders should anticipate elevated Volatility and potential sharp intraday reversals in coming sessions as the RSI normalizes.
Volume Analysis: Conviction Behind the Move
Volume at 1.05M is among the highest single-day readings on this chart and is decisively Buy-Side driven, confirming the legitimacy of today's breakout. For a stock trading at $800+, this level of volume reflects meaningful institutional repositioning and demand. Prior high-volume days on this chart were concentrated at earnings events, and each was followed by a sustained directional move — predominantly to the upside. Today's volume profile is consistent with a genuine breakout rather than a low-conviction gap, lending credibility to the idea that the move has real institutional support behind it.
Key Technical Levels and Scenarios
Support Levels
- $759–$780 — Intraday low zone; immediate session support
- $700–$720 — Psychological and near-term consolidation support
- $620–$630 — Pre-earnings base; gap support on any deep retracement
- $542.49 — EMA-21; medium-term structural support
Resistance Levels
- $845.00 — Today's all-time intraday high; immediate resistance
- $900 — Next major psychological resistance
- $1,000+ — Extended parabolic target if momentum sustains
Scenarios
- Parabolic Continuation (Possible but Risky) — RSI remains elevated, buyers absorb near-term profit-taking, and SITM grinds toward $900 over the next two to four weeks on sustained institutional demand following the earnings beat.
- Consolidation and Base-Building (Primary Case) — Price consolidates between $720 and $845 for one to three weeks, RSI cools from 90 toward 65–70, and the EMA-21 rises to meet price — setting up a healthier platform for the next leg to $900+.
- Mean Reversion Pullback (Elevated Probability Given RSI) — The extreme RSI reading triggers a sharper-than-expected pullback toward the $620–$650 pre-earnings base zone, which would Fill the gap and reset momentum without damaging the broader uptrend structure. Buyers would be expected to re-engage aggressively at that level.
Conclusion: Extraordinary Earnings Breakout Demands Both Respect and Caution
SiTime Corporation has delivered one of the most powerful single-session earnings moves in its history, vaulting to all-time highs above $845 with a +28.87% gain on strong institutional volume. The structural case for SITM remains overwhelmingly bullish — the trend is intact, moving averages are rising steeply, and today's breakout confirms that fundamental momentum is accelerating. However, the RSI-10 at 90.09 and the near-50% gap from the EMA-21 represent the highest near-term overbought and extension risk seen on this chart, making immediate chasing of the move a high-risk proposition. The most prudent approach is to monitor for a controlled consolidation that allows the EMAs to catch up and RSI to reset toward the 65–70 zone, which would provide a far more favorable risk-reward entry point for the next leg toward $900 and beyond.


 Please wait processing your request...