
Image source: Shutterstock
Highlights
- In FY24, SOFI’s net income turned positive at USD 498.7 million, improving from a loss of USD 300.7 million in FY23
- The company targets a 30% EBITDA margin in FY25
- FY25 full-year revenue is forecasted at USD3.2–3.275 billion
SoFi Technologies, Inc. (NASDAQ:SOFI) offers a range of financial services, including lending, saving, spending, investing, and protecting money.
In the financial year 2024 (FY24), SOFI reported a total interest income of USD 2,807.8 million, reflecting a 36.9% increase from FY23, driven by higher income from interest and gains from loans and securitization.
Net income turned positive in FY24 at USD 498.7 million, a significant improvement from the loss of USD 300.7 million in FY23. During the reported period, the company experienced a cash outflow of USD 1,119.8 million from operating activities, an improvement compared to the larger outflow of USD 7,227.1 million in FY23, primarily due to decreased cash flow from loan origination and purchases.
Cash and cash equivalents decreased by 17.7% YoY, from USD 3,085.2 million in FY23 to USD 2,538.3 million in FY24, reflecting cash outflows from investing and operating activities, partially offset by inflows from financing activities.
Recent Business Update
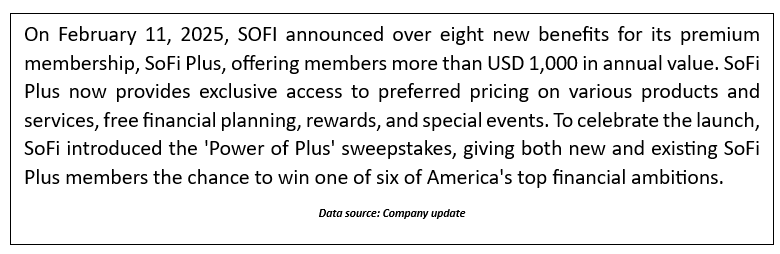
Company Outlook
In 2025, after strengthening its capital base and achieving GAAP profitability, SOFI aims for incremental revenue growth aligned with strategic investments, targeting a 30% EBITDA margin. The company projects Q1 adjusted net revenue of USD 725-745 million and full-year revenue of USD 3.2–3.275 billion, with significant member growth.
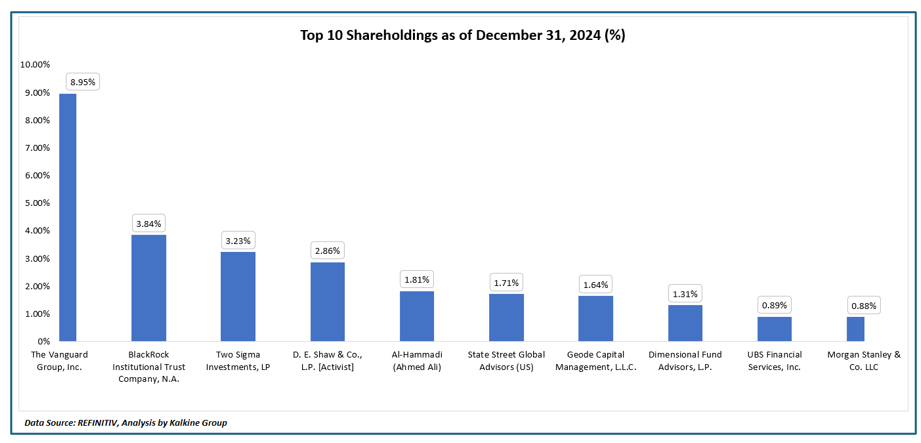
Top 10 Shareholders
The top 10 shareholders of SOFI hold about 27.11% of the total shares. This indicates concentrated shareholding. The Vanguard Group, Inc. is the largest shareholder, with a stake of around 8.95%. BlackRock Institutional Trust Company, N.A. follows, holding approximately 3.84%.
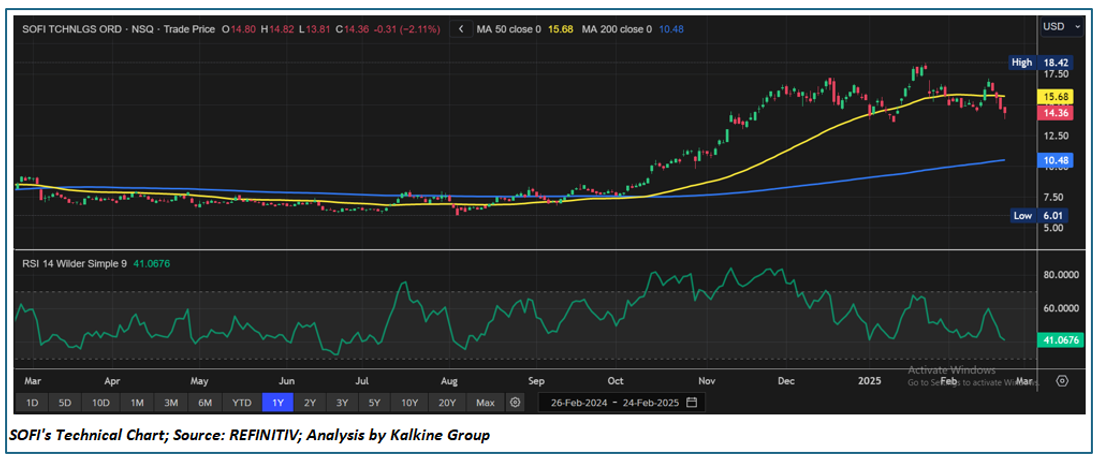
Stock Information
SOFI's share price has declined by 8.53% over the past three months. However, in the long term, the stock has delivered an impressive return of 87.22% over the last six months. Currently, the stock is trading closer to the higher end of its 52-week range, which spans from a low of USD 6.01 to a high of USD 18.42.
Note 1: Past performance is not a reliable indicator of future performance.
Note 2: The reference data for all price data, currency, technical indicators, support, and resistance levels is 24 February 2025. The reference data in this report has been partly sourced from EODHD/Others.
Technical Indicators Defined
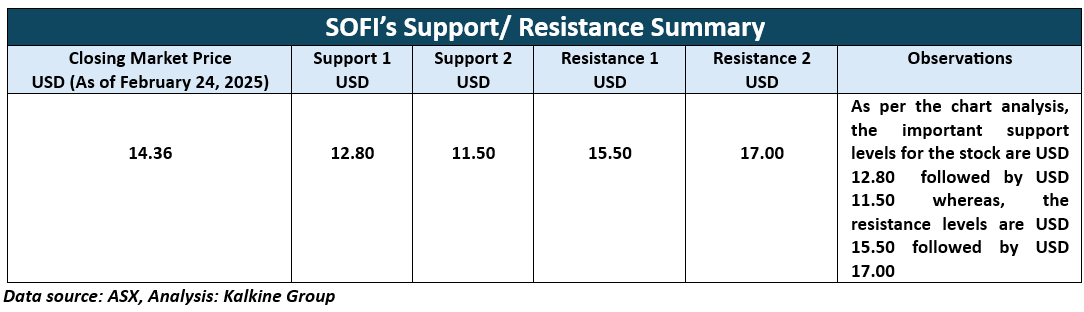
Support: A level at which the stock prices tend to find support if they are falling, and a downtrend may take a pause backed by demand or buying interest. Support 1 refers to the nearby support level for the stock and if the price breaches the level, then Support 2 may act as the crucial support level for the stock.
Resistance: A level at which the stock prices tend to find resistance when they are rising, and an uptrend may take a pause due to profit booking or selling interest. Resistance 1 refers to the nearby resistance level for the stock and if the price surpasses the level, then Resistance 2 may act as the crucial resistance level for the stock.


 Please wait processing your request...