
After shedding more than 65% from its October peaks, Solana is quietly rebuilding — and the confluence of ETF inflows, whale accumulation, and two major network upgrades is setting the stage for what could be 2026's most significant crypto recovery
Key Highlights
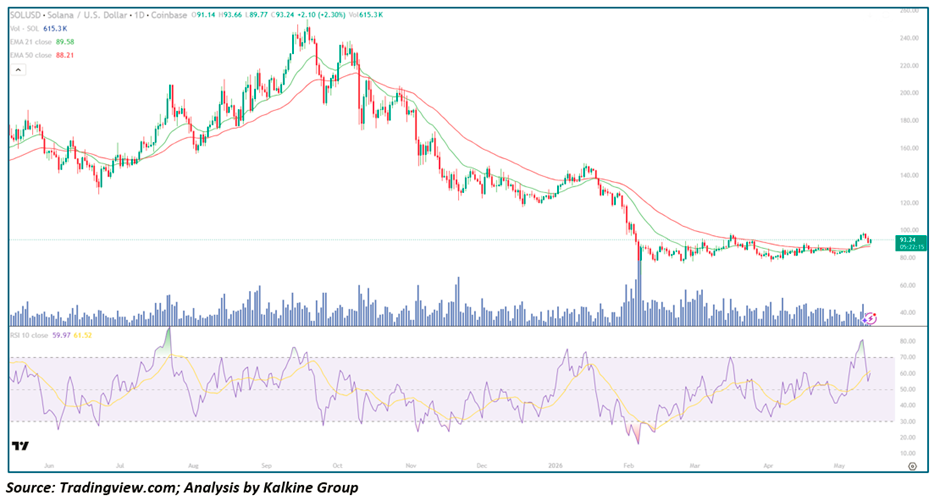
- Solana is trading at $93.24, up +$2.10 (+2.30%) on May 14, with both EMAs now reclaimed and the critical $100 psychological level within striking distance
- SOL has broken above a descending resistance Trendline that capped upside momentum since early March — a technically significant breakout backed by improving Volume
- EMA-21 ($89.58) and EMA-50 ($88.21) have both been reclaimed and are beginning to converge upward — with price trading above both for the first time since the downtrend began
- RSI-10 at 59.97 — in healthy bullish territory, with the signal line at 61.52 providing confirmation of sustained momentum; ample runway before overbought conditions
- Volume at 615.3K SOL — above recent averages — signalling renewed participation in the recovery move
- May 2026 has already posted approximately 15% gains for SOL — the second-best May performance in the coin's history
- The Alpenglow network upgrade and an imminent Firedancer deployment represent the most significant technical catalysts on Solana's roadmap in years
Trend Structure: A Historic Correction Carves Out a Multi-Month Base
The SOL Daily Chart is the story of a complete cycle compressed into twelve months. From a base near $150 in June 2025, Solana rallied explosively to all-time highs near $295 in October 2025 — a move driven by meme coin mania, retail euphoria, and Solana's dominance in onchain transaction volumes. Both EMAs trended steeply higher during this phase, consistently acting as support on pullbacks.
The Reversal was equally violent. From the October peak, SOL entered a relentless downtrend — losing more than 65% of its value through successive lower highs and lower lows, with the EMA-21 crossing below the EMA-50 and both trending steeply downward through November, December, and into 2026. A sharp flash crash in late January/early February 2026 produced one of the most extreme oversold RSI readings in Solana's history — visible as the dramatic RSI trough touching near 15–20 on the chart — which marked the ultimate Capitulation low.
From those February lows, SOL has been methodically rebuilding. Higher lows have been established across March and April, the EMAs have flattened and begun curling upward, and the recent breakout above the descending trendline that capped price since early March represents the first clear evidence that the downtrend structure has been broken. Price is now trading above both the EMA-21 and EMA-50 simultaneously for the first time in months — a structural inflection that historically precedes sustained directional moves in Solana.
The Catalysts: ETFs, Whales, Upgrades, and Ecosystem Expansion
Institutional ETF Inflows Returning
Solana ETF monthly inflows peaked at $419.38 million in November 2025 before declining sharply through the bear phase. Those inflows are now climbing again as institutional conviction around Solana's ecosystem positioning recovers — a direct structural bid beneath the market that differentiates the current recovery from previous dead-cat bounces driven solely by retail sentiment.
Whale Accumulation at Scale
Whale wallets are accumulating millions of dollars worth of SOL at current levels — a behavioural signal that sophisticated Market Participants view the $80–$95 range as a long-term value zone relative to Solana's network fundamentals. Historically, periods of sustained whale accumulation during base formations have preceded the largest directional moves in Solana's price history.
The Alpenglow Upgrade — A Network Revolution
The Alpenglow upgrade represents perhaps the most technically significant catalyst on Solana's near-term roadmap. This upgrade transitions Solana away from the existing TowerBFT consensus mechanism to two new systems: Votor, a new voting and transaction confirmation system that dramatically accelerates finality, and Rotor, a faster data-sharing system that replaces the existing Turbine protocol. Together, these changes are expected to deliver materially faster transaction confirmation times and higher throughput — directly addressing the network's scalability ceiling and making Solana even more competitive against Ethereum and other layer-1 alternatives for high-frequency applications.
Firedancer: The Performance Multiplier
The Firedancer validator client upgrade — developed by Jump Crypto — is approaching deployment and represents a complete reimplementation of the Solana validator in C++ designed to deliver multiple times the throughput of the current Rust-based implementation. Firedancer has the potential to push Solana's practical transaction throughput to levels no other general-purpose blockchain can match — a genuine technological moat that institutional infrastructure builders are already pricing into long-term positioning decisions.
Western Union Stablecoin Integration
Western Union's integration with Solana for stablecoin-based payments represents exactly the kind of real-world adoption that bridges the gap between crypto infrastructure speculation and demonstrable economic Utility. With Western Union processing billions of dollars in remittances annually, Solana-based stablecoin payments could drive a meaningful and sustained increase in genuine network transaction volume — the kind of usage that supports a durable token price premium rather than speculative Demand alone.
The AI Machine Economy Narrative
Solana Foundation President Lily Liu has articulated a compelling forward thesis: Solana is building the payment rails for the "AI machine economy" — the emerging infrastructure layer that enables AI agents to transact autonomously at scale. With Solana's sub-second finality and negligible Transaction Costs, it is uniquely positioned among layer-1 blockchains to serve as the settlement layer for machine-to-machine micropayments — a market that does not yet exist at scale but could represent an enormous addressable opportunity as AI agent deployment accelerates.
Record Network Activity
Solana processed 25.3 billion transactions in the most recent quarter — a network activity level that underscores the genuine utility and adoption of the blockchain beyond speculative trading. This level of onchain activity provides fundamental support for the SOL token that is independent of market sentiment cycles.
Moving Averages: The First Bullish EMA Alignment in Months
The EMA structure has undergone a meaningful transformation:
- EMA-21 ($89.58) — reclaimed decisively; now acting as dynamic support with price trading above it
- EMA-50 ($88.21) — also reclaimed; the narrow $1.37 gap between the two EMAs sets up an imminent golden cross
The near-convergence of EMA-21 and EMA-50 — with both beginning to slope upward and price trading above both — represents the clearest bullish EMA signal on the SOL daily chart since the October 2025 peaks. A confirmed golden cross, with price holding above the $90–$92 support zone, would mark the technical confirmation of a full trend reversal from bear to bull phase.
Pullbacks toward the $88–$90 zone — the EMA cluster — would represent the highest-quality re-entry opportunities within the developing recovery structure, provided the broader crypto market remains constructive.
Momentum &Amp; Volume: RSI Mid-Cycle With Room to Run
The RSI-10 at 59.97 — with the signal line at 61.52 — sits in precisely the sweet spot for a trending market: above the 50 midline confirming bullish bias, but well below the 70 overbought threshold that would signal exhaustion. The signal line is actually slightly above the fast RSI, suggesting a brief consolidation within the uptrend rather than a reversal — and providing a natural setup for the next momentum expansion leg once RSI crosses back above 61.52.
The RSI trajectory from the February lows near 15–20 through the current 59–60 range reflects a systematic, multi-month momentum recovery — not a spike-and-fade pattern, but a gradual staircase of higher lows in momentum that mirrors the higher lows being established in price. This type of RSI structure is characteristic of genuine trend reversals rather than Bear Market bounces.
Volume at 615.3K SOL — while not yet at the explosive levels that accompanied the October 2025 rally — is showing a constructive uptick relative to the thin, low-conviction volumes that characterised the February–March base formation period, suggesting that fresh Capital is beginning to engage with the recovery.
Key Technical Levels and Scenarios
Resistance Levels
- $95–$96.85 — Immediate resistance; recent swing high and first meaningful hurdle
- $100.00 — Critical psychological resistance; last tested on February 2, 2026 — a clean break above this level would mark a major sentiment shift
- $120–$130 — Next structural resistance zone from the December 2025 consolidation
- $160–$180 — Major resistance from the 2025 downtrend; upper target for a full trend reversal scenario
- $295 — All-time high; ultimate bull case
Support Levels
- $89.58–$88.21 — EMA-21/EMA-50 cluster (critical dynamic support; must hold on pullbacks)
- $82–$85 — Prior consolidation zone and breakout retest support
- $75–$78 — Major structural support from the February base
- $67–$70 — Ultimate support; catastrophic failure level only in the event of macro-driven crypto selloff
Scenarios
- Bullish Continuation (Primary Case) — SOL holds above the EMA cluster at $88–$90, confirms a golden cross in coming sessions, and extends through $95 resistance toward the psychologically significant $100 level — which, once cleared, could trigger institutional FOMO and momentum acceleration toward $120–$130.
- Consolidation (Secondary Case) — Price ranges between $85–$96 through May/June as the market digests the trendline breakout and awaits the Alpenglow upgrade deployment for the next directional catalyst. This would represent a healthy higher-base formation before the next leg.
- Bearish Rejection (Tail Case) — Failure to hold the EMA cluster at $88–$90 on a closing basis, potentially triggered by broader crypto market weakness or a Bitcoin correction, sends SOL back toward $78–$82 support — which, if defended, would still represent a higher low and maintain the recovery structure intact.
The Bear Case: Macro Sensitivity and a Long Road Home
The risks around Solana are real and deserve honest assessment. SOL remains one of the most Beta-sensitive Assets in the crypto universe — Bitcoin corrections of 10–15% can translate into 25–30% drawdowns in SOL without any network-specific catalyst. The macro backdrop of elevated Inflation, geopolitical tension from the Iran conflict, and a Federal Reserve that has essentially ruled out rate cuts in 2026 creates a challenging environment for speculative risk assets.
The meme coin ecosystem that drove much of Solana's 2024–2025 surge has cooled considerably, and with it, a meaningful portion of the fee Revenue and network activity that justified premium valuations. While the Alpenglow and Firedancer upgrades are genuine technical milestones, upgrade timelines in crypto have a long history of slipping — and the market has learned not to price in speculative catalysts too aggressively ahead of confirmed deployment.
At $93, SOL is still approximately 68% below its all-time high — a reminder of the extraordinary mountain to climb for investors expecting a return to peak valuations.
Conclusion: Solana's Second Act Is Beginning — But Patience Is Still Required
Solana's correction from $295 to $75 was one of the most severe in the history of a top-10 Cryptocurrency — and the base that has formed over the subsequent months reflects the genuine work of accumulation at deeply discounted prices. The technical structure is now showing the first clear signs of a sustainable reversal: trendline breakout, EMA reclaim, RSI mid-cycle recovery, and improving volume. The fundamental catalysts — Alpenglow, Firedancer, institutional ETF inflows, Western Union stablecoin integration, and the AI payment rails narrative — provide a credible fundamental backdrop for the next major price expansion.
The $100 level is the line in the sand. A confirmed daily close above $100 — backed by volume and EMA support — would mark the clearest signal that Solana's bear market is definitively over and that the network is entering a new structural bull phase. Until that level is cleared and held, the recovery remains a base-building exercise requiring patience. But for investors willing to look twelve to eighteen months ahead, the current zone of $88–$95 — where both EMAs are converging and the structure is turning bullish — may prove to be one of the most attractive entry points in Solana's history.


 Please wait processing your request...