
The index has clawed back some ground after a brutal sell-off, but the chart tells a story of relief rather than revival — and the weight of technical evidence counsels against mistaking the two
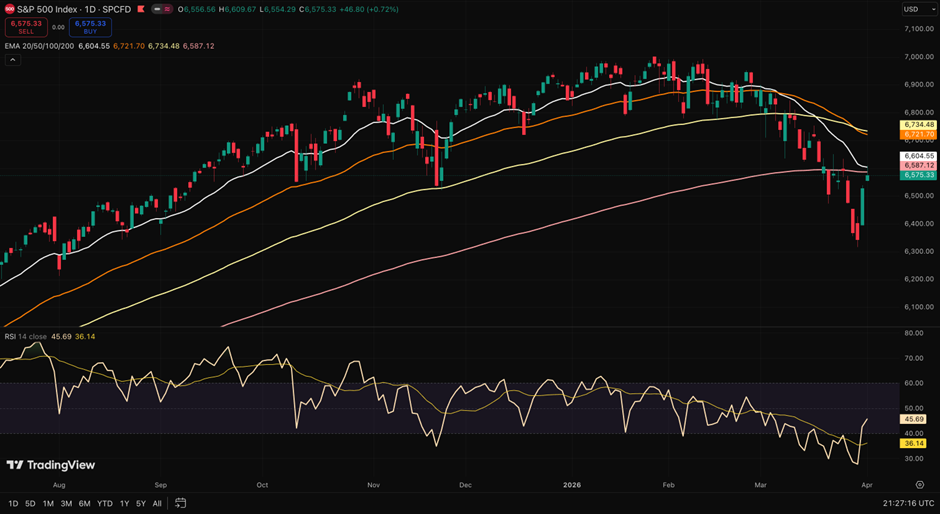 S&P 500 Daily Price Chart. Source: tradingview.com, Analysis by Kalkine Group
Two days of gains on the S&P 500 have offered weary bulls a moment to breathe. They should resist the urge to exhale fully.
After peaking close to the psychologically significant 7,000 level and then embarking on a sharp, near-vertical decline through March — one of the more brutal directional moves the index has seen in recent memory — the S&P has bounced. But the manner of that bounce, and the technical landscape surrounding it, carries all the hallmarks of a relief rally rather than a genuine inflection point. The distinction matters enormously to anyone tempted to call a bottom.
The Moving Average Verdict
The most damning evidence sits in the moving averages. The index is currently trading below all four exponential moving averages tracked on the daily chart — the 20, 50, 100, and 200-period measures sitting at 6,604, 6,721, 6,734 and 6,587 respectively. Taken together, they form a layered and formidable ceiling of resistance directly overhead.
This is not a chart that has merely pulled back to test support in an otherwise healthy uptrend. It is one that has broken cleanly beneath its entire moving average structure — a configuration that, in technical terms, signals a meaningful deterioration in trend rather than a routine correction. What was once a rising staircase of support has become a descending series of hurdles. Clearing them all in short order would be a tall order indeed.
The 200-period EMA at 6,587 — historically one of the most watched long-term trend indicators — now roughly coincides with current price action, and may offer a momentary technical prop. But in the context of a sell-off as swift and decisive as this one, first contact with a major moving average tends to be a skirmish rather than a resolution. Markets rarely find durable floors on the first touch.
RSI: Momentum Yet to Turn
The Relative Strength Index reinforces the cautious reading. At 36.14 on the 14-period measure, the RSI remains in bearish territory, well adrift of the 50 midpoint that would signal any credible recovery in buying strength. More tellingly, the indicator has been in steady decline since February — a period during which the index mounted several attempted bounces, only for sellers to reassert control each time. The RSI's current uptick from deeply oversold territory is consistent with a technical snap-back, not a momentum reversal.
Relief or Reversal? The Bar Is High
For the two-day rally to graduate from relief bounce to something more structurally meaningful, the index would need to reclaim the 100 and 50-period EMAs with conviction, sustain trade above the 200-period average, and see the RSI push decisively through the 50 level. None of those conditions are close to being met. The gap between current price and the cluster of moving averages above is not trivial — it represents the distance between where the market is and where it would need to be for the technical picture to genuinely improve.
There is, of course, nothing unusual about sharp counter-trend rallies occurring within broader downtrends. They are a feature, not a bug, of declining markets — and they can be violent enough to wrong-foot traders who have leaned too heavily short. But violence and sustainability are different things.
The S&P 500's chart, read dispassionately, is one of a market that has broken down, bounced from oversold levels, and now faces a meaningful test of overhead resistance. Until that resistance is cleared and momentum confirms the move, the two-day rally is best understood for what the evidence suggests it most likely is: the market pausing for breath — not changing its mind.


 Please wait processing your request...