
A textbook staircase uptrend, consistent EMA support, and a fresh breakout to multi-year highs — SU is the definition of disciplined bullish price action
Key Highlights
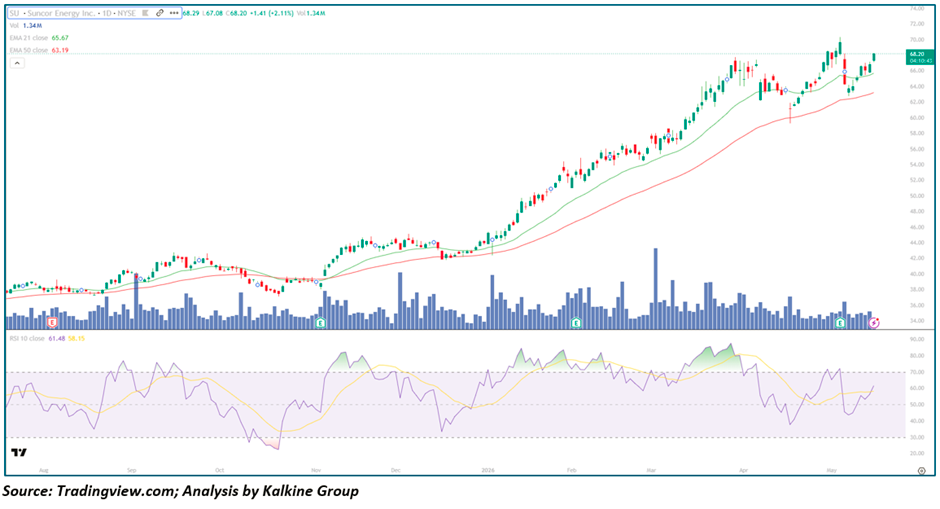
- Suncor Energy Inc. (NYSE: SU) is trading at $68.20, up +$1.41 (+2.11%), pushing into fresh multi-year high territory
- Stock has rallied nearly 80% from its August 2025 base of ~$38, reflecting a powerful and sustained institutional accumulation cycle
- EMA-21 ($65.67) and EMA-50 ($63.19) are widely separated and steeply rising — confirming a robust and accelerating bullish trend structure
- Price is trading ~4% above EMA-21 — a healthy and sustainable extension, unlike the parabolic stretches seen in higher-Beta names
- RSI-10 at 61.48 — in bullish momentum territory with signal at 58.15, recovering cleanly from recent consolidation without ever entering overbought excess
- Volume at 1.34M — steady and consistent, reflecting institutional accumulation rather than speculative rotation
Trend Structure: The Staircase Uptrend — A Rare and Powerful Configuration
Suncor Energy's chart is among the most technically pristine on the board — a slow, deliberate, staircase-style uptrend that has compounded relentlessly over nine months without the violent reversals that characterise lesser-quality trends.
From August 2025, SU traded in a sideways consolidation band between $38–$42, with the EMAs flat and momentum neutral. This was the quiet accumulation phase — large investors building positions before the move began, evident in the consistently moderate volume baseline during this period.
The breakout arrived in late October 2025, when SU launched from its base on rising volume and began what would become a near-uninterrupted six-month climb. The advance has been structured in classic institutional fashion — each impulse wave higher is followed by a brief consolidation or shallow pullback that finds support at or near the EMA-21, before the next leg begins. This pattern has repeated with remarkable consistency across September, November, December, January, February, March, and April — seven distinct tests of the EMA-21 or EMA-50, each one holding, each one launching the next wave higher.
The most recent leg from the April consolidation near $62–$63 has now extended SU to fresh multi-year highs above $68 — territory where there is no meaningful overhead Supply and price discovery becomes the operative dynamic. The breakout is confirmed, the structure is intact, and the trend shows no signs of exhaustion.
The Catalysts: Why SU Has Become One of the Strongest Energy Names on the NYSE
Oil Sands Operational Excellence Suncor's integrated oil sands Business model — combining Upstream production with Downstream refining and retail — provides a natural hedge against Commodity price Volatility that pure-play producers lack. Consistent operational delivery has driven a sustained re-rating of the stock's quality multiple.
Capital Discipline and Shareholder Returns Management's commitment to share Buybacks and Dividend growth has made SU increasingly attractive to income-oriented and value-focused institutional investors. The visible Earnings events (E markers) on the chart have each been absorbed positively — a consistent pattern of meeting or exceeding expectations.
Energy Transition Hedge Unlike many peers, Suncor has been investing in operational efficiency improvements and emissions reduction at its oil sands operations — positioning the company as a more sustainable producer within a sector facing long-term structural questions, which has broadened its institutional investor base.
Canadian Dollar and Commodity Tailwinds The combination of a recovering oil price environment and a relatively weak Canadian dollar — which benefits Suncor's USD-denominated revenues against CAD-denominated costs — has provided a dual earnings tailwind that the market has progressively re-priced throughout the rally.
Valuation Re-Rating Starting from a depressed valuation base in mid-2025, the market has been systematically re-rating SU toward more appropriate multiples for a high-quality, integrated energy major — a process that may not yet be complete given the stock's continued breakout to new highs.
Moving Averages: The Gold Standard of Bullish Configuration
- EMA-21 ($65.67) — steeply rising, has served as the primary dynamic support level across the entire nine-month uptrend with near-perfect reliability
- EMA-50 ($63.19) — accelerating higher, providing the deeper structural backstop that has only been tested on the most significant pullbacks
The spread between the two EMAs at approximately $2.48 — with both lines rising in parallel — is the hallmark of a trend in full acceleration. More importantly, the angle of both EMAs has been steadily increasing throughout the rally, suggesting that momentum is building rather than fading. This is the opposite of a trend approaching exhaustion; it is a trend that is maturing into its strongest phase.
The circular markers visible on the chart represent precise EMA-21 touch points — each one a successful test of support that launched the next leg higher. The number and consistency of these touches, combined with the absence of any meaningful EMA violation on a closing basis, makes this one of the cleanest trend structures visible across any timeframe or sector.
Momentum &Amp; Volume: The Perfect Combination of Strength and Sustainability
The RSI-10 at 61.48 — with signal at 58.15 and the RSI line crossing above its signal — is arguably the most attractive momentum reading on the chart from a risk/reward perspective. Unlike overbought readings at 80+ that signal potential exhaustion, an RSI in the 60–65 zone within a confirmed uptrend represents the sweet spot: strong enough to confirm buying pressure, cool enough to have significant runway before any overheating concern.
Critically, a review of the RSI history across the nine-month chart reveals a consistent pattern — every time RSI has cooled into the 40–50 zone during a pullback and then re-crossed above 50 and toward 60, the next significant price leg higher has followed. The current reading represents exactly that configuration.
Volume at 1.34M is steady and constructive — not a speculative volume spike, but the consistent institutional flow that has characterised SU's advance throughout. The elevated volume spikes visible at key earnings events and during the February–March period have each been absorbed without disrupting the trend, confirming deep and genuine institutional support for the stock at current levels.
Key Technical Levels and Scenarios
Resistance Levels
- $69.00–$70.00 — Immediate psychological resistance and near-term target
- $72.00–$73.00 — Extended bull case visible at the top of the chart range
- $75.00+ — Longer-term target if commodity tailwinds and operational momentum persist
Support Levels
- $65.67 — EMA-21 — primary dynamic support and ideal pullback entry zone
- $63.19 — EMA-50 — major structural support and high-conviction accumulation zone
- $60.00–$61.00 — Prior consolidation resistance now turned support
- $56.00–$57.00 — February 2026 consolidation base — last line of trend defence
Scenarios
- Continued Breakout to New Highs (Primary Case) SU holds above the $66–$67 breakout zone, consolidates briefly, and extends toward $70–$72 on continued energy sector strength and positive fundamental momentum. The absence of overhead supply above $68 and the constructive RSI configuration strongly support this as the highest-probability outcome.
- Shallow Pullback to EMA-21 (Secondary Case) A brief profit-taking episode pulls SU back toward the EMA-21 at $65.67 — a move of less than 4% from current levels. This would be entirely consistent with the historical pattern of EMA-21 retests throughout the uptrend and would represent the optimal entry point for investors not yet positioned. Expect strong buying support at this level.
- Deeper Correction to EMA-50 (Lower Probability) An adverse macro shock — sharp oil price decline, broader market selloff, or negative company-specific news — pushes SU toward the EMA-50 at $63.19. While this would be uncomfortable, the EMA-50 has provided formidable support throughout the entire rally and would be considered a high-conviction buying opportunity within the context of the unchanged long-term trend.
The Bear Case: Low Probability but Acknowledged Risks
Suncor's technical picture is arguably the most constructive on the board, but macro risks cannot be dismissed:
- Oil price sensitivity remains the primary systemic risk — a significant deterioration in crude prices driven by Demand concerns (China slowdown, global Recession fears) or supply increases (OPEC+ Reversal) would directly challenge the fundamental underpinning of the rally
- Energy sector rotation risk — as AI and technology narratives dominate institutional allocation, energy stocks can face outflows even when fundamentals remain supportive
- Geopolitical exposure — oil sands operations, while domestically stable, are subject to Canadian regulatory and carbon pricing policy evolution that could affect long-term cost structures
- Currency dynamics — a material strengthening of the Canadian dollar against the USD would compress Suncor's competitive cost advantage
However, it must be emphasised: none of these risks are currently visible in the price action, volume, or momentum indicators. Until the chart itself signals deterioration — through an EMA violation, volume-confirmed breakdown, or RSI structural decline below 50 — these remain theoretical rather than actionable concerns.
Conclusion: The Highest-Quality Trend on the Energy Board — Own It, Add on Dips, Respect the Structure
Suncor Energy represents the gold standard of what a sustained institutional uptrend should look like — methodical, consistent, high-quality, and built on genuine fundamental improvement rather than speculative excess. The nine-month staircase advance from $38 to $68 has been constructed with a discipline that distinguishes it from the volatile crypto and high-beta tech names dominating headlines.
At current levels, the stock is in a confirmed breakout to multi-year highs with constructive momentum, healthy volume, and both EMAs rising steeply in support. The RSI at 61.48 provides ample headroom for the next leg, and the historical pattern of EMA-21 support gives traders a precise, data-backed risk management framework.
The strategy is simple: hold existing positions with a trailing stop below the EMA-21 at $65.67, and treat any pullback toward that level as a high-conviction accumulation opportunity. For new entrants, the current breakout provides a valid entry with defined risk, while the $63.19 EMA-50 zone offers the most favourable risk/reward entry for patient investors willing to wait for a deeper setup.
With $70–$72 as the immediate target, $75 as the medium-term bull case, and one of the most trustworthy trend structures on the NYSE providing the framework, Suncor Energy deserves a core position in any technically-driven portfolio with energy exposure.


 Please wait processing your request...