
Image source: Shutterstock
Highlights
- TSM reported FY24 revenue of NTD 2,894.0 million, a 33.9% year-on-year increase
- Net income for FY24 rose by 39.9% YoY, reaching NTD 1,172.4 million
- TSM plans a CapEx budget of USD 38-42 billion for 2025, focusing on advanced technologies
Taiwan Semiconductor Manufacturing Co Ltd (NYSE:TSM) is a Taiwan-based company engaged in the provision of integrated circuit manufacturing services.
For the financial year 2024 (FY24), TSM reported a total revenue of NTD 2,894.0 million, reflecting a 33.9% year-on-year increase from NTD 2,161.0 million in FY23. The growth was driven by a 14.3% sequential revenue increase, supported by higher demand for the industry-leading 3nm and 5nm technologies.
Net income also saw a significant rise, increasing by 39.9% YoY to NTD 1,172.4 million from NTD 837.8 million in FY23. This improvement was primarily due to a decreased cost of revenue and operating expenses as a percentage of total revenue, although partially offset by higher tax expenses. Additionally, cash inflow from operating activities surged by 57.1% YoY, reaching NTD 620.3 million in Q4FY24, driven by higher net income and increased non-cash expenses. Cash and cash equivalents grew by 45.2% YoY in FY24, reaching NTD 2,127.0 million, owing to strong cash inflow from operating activities, though partially offset by cash outflows from investing and financing activities.
According to the company’s consolidated revenue report for February 2025, its net revenue was NTD 260.01 billion, reflecting an 11.3% drop compared to January 2025, but marking a 43.1% increase compared to February 2024.
Company Outlook
TSMC's forward-looking capital expenditure (CapEx) strategy focuses on aligning investments with long-term market demand, exemplified by its USD 29.8 billion investment in 2024. This supports expansion in areas like 5G, AI, and HPC. For 2025, the company plans a CapEx budget of USD 38-42 billion, prioritizing advanced process technologies, specialty technologies, and related activities, reinforcing its market leadership and shareholder value.
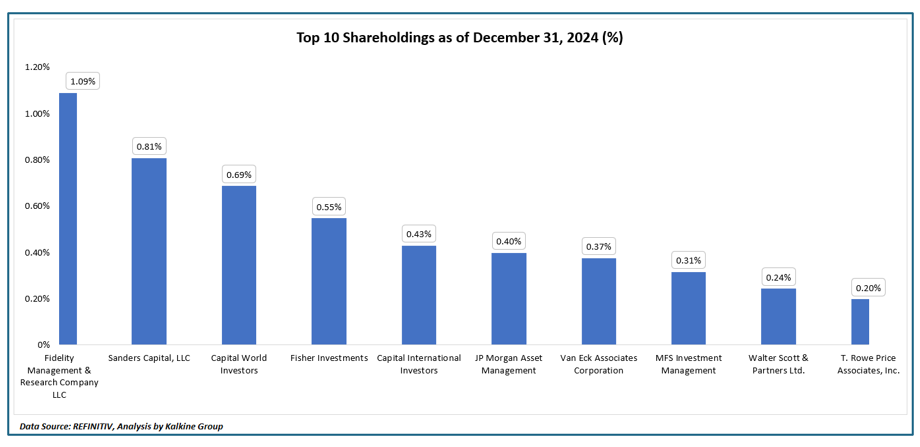
Top 10 Shareholders
The top 10 shareholders of TSM hold approximately 5.08% of the total shares, reflecting a diverse ownership structure. The largest stakeholders are Fidelity Management & Research Company LLC and Sanders Capital, LLC, with stakes of around 1.09% and 0.81%, respectively.
Stock Information
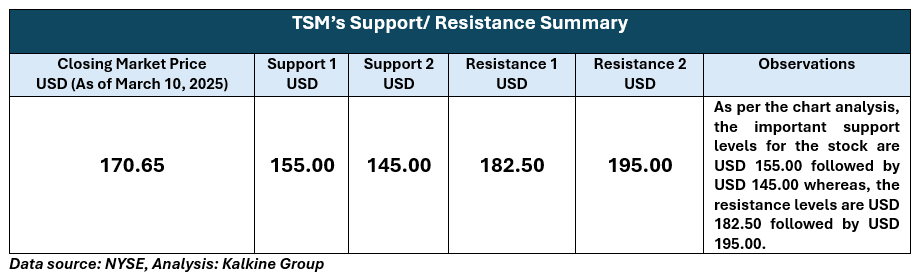
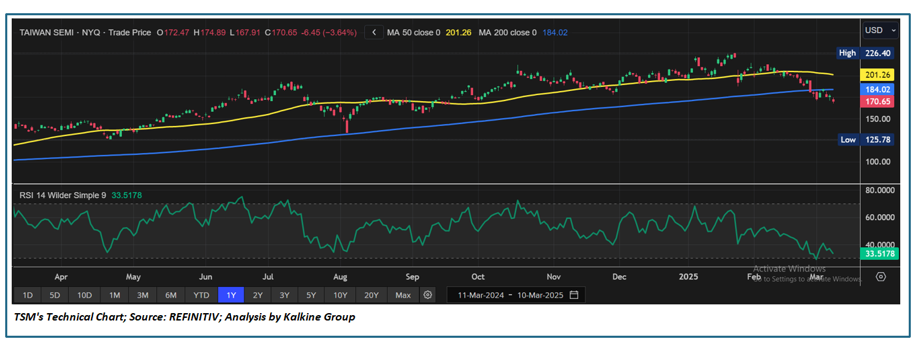
TSM's share price has experienced a 14.31% correction over the past three months. However, in the long term, it has delivered a 4.83% return over the last six months. Currently, the stock is trading closer to the lower end of its 52-week range, which spans from a high of USD 226.40 to a low of USD 125.78 with a closing price of USD 170.65 as of March 10, 2025.
Note 1: Past performance is not a reliable indicator of future performance.
Note 2: The reference data for all price data, currency, technical indicators, support, and resistance levels is March 10, 2025. The reference data in this report has been partly sourced from EODHD/Others.
Technical Indicators Defined
Support: A level at which the stock prices tend to find support if they are falling, and a downtrend may take a pause backed by demand or buying interest. Support 1 refers to the nearby support level for the stock and if the price breaches the level, then Support 2 may act as the crucial support level for the stock.
Resistance: A level at which the stock prices tend to find resistance when they are rising, and an uptrend may take a pause due to profit booking or selling interest. Resistance 1 refers to the nearby resistance level for the stock and if the price surpasses the level, then Resistance 2 may act as the crucial resistance level for the stock.


 Please wait processing your request...