
Key Highlights
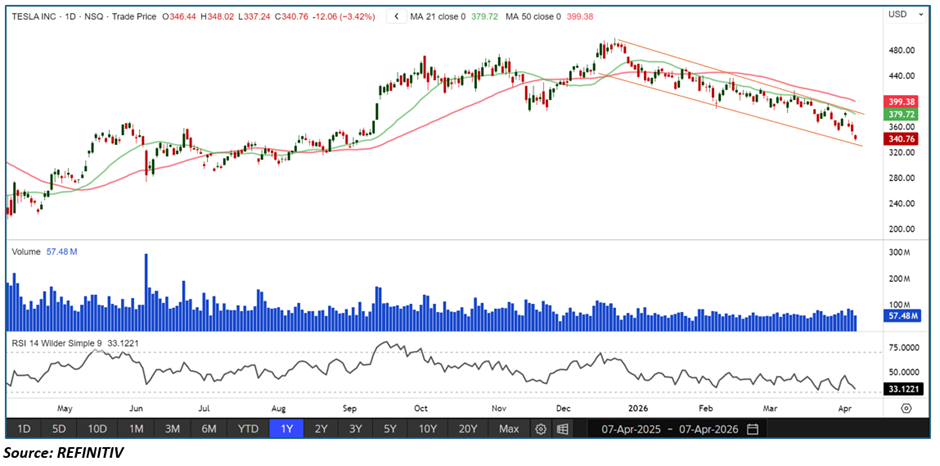
- Tesla Inc. has broken below the critical $365 support level, confirming structural weakness
• Price is trending within a well-defined downward channel, reinforcing a bearish trend
• Disappointing Q1 2026 delivery and production data has weighed on sentiment
• RSI near 33 signals strong negative momentum and growing selling pressure
• Price remains below both the 21-day and 50-day moving averages, which now act as resistance
Trend Structure: Downward Channel Defines Bearish Control
Tesla is currently trading within a descending channel pattern, characterized by:
• Lower highs along the upper boundary
• Lower lows along the lower boundary
• Consistent rejection at channel resistance
This structure clearly indicates:
• Sustained seller dominance
• Controlled downward price progression
• Limited ability for bulls to regain control
As long as price remains inside this channel, the trend bias remains firmly bearish.
Price Action: Breakdown Confirms Structural Shift
The recent move below the $365 support level marks a significant technical breakdown:
• Signals transition from consolidation to bearish continuation phase
• Indicates loss of key demand zone
• Suggests increased willingness of sellers to push prices lower
Following the breakdown:
• Price has continued to respect the channel structure
• Recovery attempts remain weak and short-lived
RSI Momentum: Oversold Pressure Reflects Strong Bearish Bias
The 14-period RSI is trending near 33:
• Indicates strong bearish momentum
• Approaching oversold territory but not yet signaling reversal
• Confirms that sellers remain in control
Sustained RSI weakness often accompanies trending declines, especially within channel structures.
Moving Average Analysis: Strong Overhead Resistance
Tesla is trading below key moving averages:
• 21-day SMA trending downward, acting as near-term resistance
• 50-day SMA also declining, reinforcing broader resistance
Key observations:
• Price remains pinned below both averages
• Any rallies toward these levels are likely to face selling pressure
• The downward slope confirms trend deterioration
These moving averages now act as dynamic ceilings, limiting upside potential.
Market Structure: Bearish Continuation Within Controlled Trend
The broader setup reflects:
• A structured downtrend within a channel
• Weak bullish participation
• Consistent selling into rallies
This environment typically leads to:
• Gradual continuation lower
• Occasional short-term bounces that fail near resistance
Key Technical Scenarios
- Continued Channel Decline (Primary Scenario)
If current trend persists:
• Price likely continues moving lower within the channel
• Lower boundary may act as next downside target
• Moving averages continue to cap rallies - Temporary Bounce Within Channel
If short-term relief occurs:
• Price may rebound toward channel resistance
• 21-day SMA likely to act as first barrier
• Bounce may be corrective rather than trend-changing - Bullish Breakout (Low Probability Near-Term)
If momentum shifts:
• Break above channel resistance and moving averages required
• RSI must recover above 50
• Would signal early trend reversal
Risk Considerations
- Oversold RSI may trigger short-term technical bounces
• Channel breakdown or breakout could accelerate volatility
• External catalysts (macro or company-specific news) may shift sentiment quickly
• False breakouts remain possible in trending markets
Conclusion: Tesla Remains Under Strong Bearish Pressure
Tesla Inc. (TSLA) is exhibiting clear bearish technical characteristics, with price trending inside a downward channel and holding below key moving averages. The breakdown below $365 confirms structural weakness, while RSI indicates strong downside momentum.
Unless Tesla can break above channel resistance and reclaim its moving averages, the path of least resistance remains to the downside, with continued pressure expected in the near term.


 Please wait processing your request...