Key Highlights
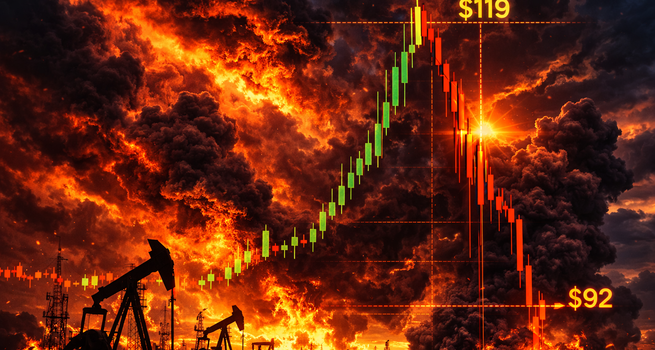
- Brent crude briefly surged above $119 per barrel after Israeli strikes on Iranian oil infrastructure.
- Prices reversed sharply as governments signalled emergency supply interventions.
- The Strait of Hormuz once again proved to be the world’s most critical energy chokepoint.
- Financial markets rapidly repriced geopolitical risk within a single trading session.
- The episode revealed how fragile global energy security remains in a multipolar world.
There are sessions that traders forget by the following Monday. And then there are sessions that get printed in textbooks. March 9, 2026 belongs firmly in the second category. In the span of a single trading day, Brent crude — the global benchmark for oil — surged more than 30 percent to briefly touch $119.50 a barrel, only to violently reverse and turn negative on the day, closing down roughly 7 percent. The wild intraday candlestick printed on the TradingView five-minute chart tells the story of a market caught in a geopolitical maelstrom it did not fully anticipate, and then swiftly recalibrating when cooler calculations took hold.
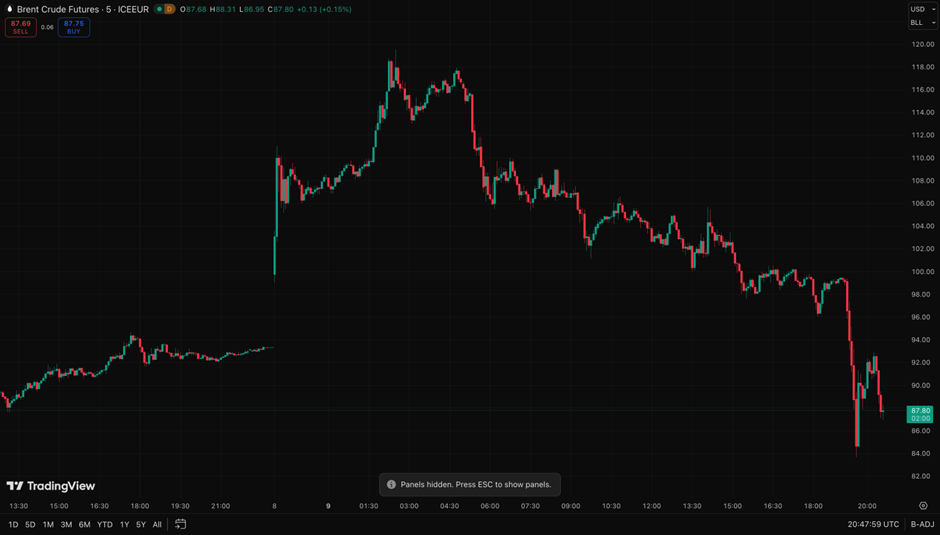
Brent Crude Futures (BZ) 5-minutes Chart. Source: tradingview.com
The catalyst was the Israeli military’s decision on Saturday, March 8, to directly target Iran’s oil infrastructure for the first time since the outbreak of the broader US-Israel war on Iran that began on February 28. Plumes of smoke rising from Tehran’s Shahran oil depot, captured on satellite and broadcast globally within hours, served as the starting gun for a surge that would briefly erase years of relative energy market calm.
The Chart: A Picture Worth $30
The five-minute Brent Crude Futures chart for March 9 is unlike almost any other in recent memory. What it shows is a market that opened at around $91 per barrel — itself already elevated from pre-conflict levels below $60 — and almost immediately vaulted skyward on the Sunday evening open, eventually reaching $119.50. That single candle wick represents the first time oil traded above $100 per barrel since Russia’s full-scale invasion of Ukraine in 2022.
Then came the reversal. Over the course of several hours, prices erased the entirety of those gains and pushed negative on the day, settling near $92.61 by the time the timestamp in the screenshot reads 20:29 UTC. That intraday collapse — from $119 to below $85 at the session’s low, before a partial recovery — is the signature of a market that overpriced fear, then rapidly repriced pragmatism. This is not a story of irrational traders. It is a story of rational actors processing an extraordinary volume of information in real time.
The Kindling: Ten Days of Escalation
To understand March 9, you must understand the ten days that preceded it. On February 28, the United States and Israel launched a massive coordinated military strike across multiple cities in Iran, targeting leadership compounds, nuclear facilities, missile sites, and military infrastructure. The operation killed Supreme Leader Ayatollah Ali Khamenei and, according to US officials, represented the largest American air armada assembled in the Middle East since the 2003 invasion of Iraq.
Iran’s retaliation was swift and wide. Tehran launched missile and drone strikes against US bases, Israeli territory, and allied Gulf state infrastructure. Refineries and liquefied natural gas facilities in Bahrain, Kuwait, Qatar, Saudi Arabia, and the United Arab Emirates were targeted in attacks broadly attributed to Iran. Most critically, Iran’s Revolutionary Guard declared the Strait of Hormuz effectively closed — threatening to set ablaze any vessel attempting to transit the narrow waterway through which roughly one-fifth of the world’s oil supply normally flows.
The consequences for regional energy output were immediate. Iraq’s three main southern oilfields saw production collapse by 70 percent, from 4.3 million barrels per day to just 1.3 million barrels per day. Kuwait announced precautionary production cuts. The UAE said it was “carefully managing offshore production levels.” Oil that had been pumped could no longer be shipped. Gulf producers were running out of storage space as crude piled up with nowhere to go. The market was staring at a deficit of roughly 20 million barrels per day that could not move through the Strait.
The Spark: Israel Hits Iran’s Oil Fields
Against this already combustible backdrop, Israel made a consequential decision on Saturday, March 8. For the first time in the conflict, Israeli air raids directly targeted Iranian oil infrastructure. Smoke billowed from the Shahran oil depot in Tehran. This was a significant strategic and symbolic escalation — prior Israeli strikes had focused on nuclear sites, missile batteries, and military command. Hitting oil was different. It signalled a willingness to weaponise Iran’s economic lifeblood.
When energy markets opened Sunday evening, the reaction was visceral. Brent crude spiked more than 30 percent. Analysts at Barclays had already warned clients that Brent could hit $100 per barrel; UBS had flagged the possibility of prices exceeding $120. Both calls were briefly correct at the same time. The fear embedded in that move was not merely about Iran’s roughly 3.3 million barrels per day of production — significant, but replaceable in theory by OPEC spare capacity. The fear was existential: that the conflict would metastasise into a sustained attack on the entire Persian Gulf energy ecosystem.
The Reversal: Why the Market Crashed Back
The collapse from $119 back below $85 — and the eventual close near $92.61 — was driven by a convergence of forces that hit the market within hours of the opening surge. The first was an intervention signal from the Group of Seven. G7 finance ministers confirmed they were ready to take any steps needed to support global energy supply, including releasing strategic petroleum reserves. This single statement, even without a concrete action, was enough to begin unwinding some of the panic premium.
The second catalyst was OPEC+ itself. Eight member countries announced an above-expectation production increase of 206,000 barrels per day, a clear signal from the cartel that it would attempt to cushion any market disruption. Saudi Arabia and the UAE, whose pipeline networks can partially bypass the Strait of Hormuz through the East-West Petroline and the Habshan-Fujairah route respectively, were signalling their capacity to route around the chokepoint. These pipelines, normally underutilised, offered a partial release valve for Gulf barrels trapped behind Iran’s effective blockade.
The third factor was President Trump’s own commentary. Telling CBS News that ships were moving through the Strait and suggesting the war would “soon be over,” Trump injected a degree of resolution optimism into a market that had priced in prolonged catastrophe. Traders, already exhausted from the violent whipsaw, began to cover short positions and take profits on panic longs. The result was the spectacular downside candle that dominates the right side of the chart.
The Structural Reality: Why Oil Was Vulnerable
What made March 9 possible was not just the geopolitical shock — it was the specific architecture of global oil dependency. The Strait of Hormuz is uniquely irreplaceable. Saudi Arabia, the UAE, Iraq, Kuwait, and Qatar all depend on it for the bulk of their crude exports. According to the US Energy Information Administration, Saudi Arabia alone accounts for approximately 38 percent of total crude flows through the Strait, or around 5.5 million barrels per day. The UAE and Saudi bypass pipelines combined can accommodate only about 2.6 million barrels per day — a fraction of what normally transits the narrow waterway.
Iran, despite being under severe sanctions and the immediate target of military action, retains enormous leverage precisely because of its geography. Its coastline forms the northern shore of the Strait. Even a degraded Iran can threaten the waterway. The irony of the Israeli strike on Iranian oil infrastructure was that it increased the probability of Iran using its most devastating weapon — the Strait itself — more aggressively, even as Iranian production capacity was being reduced. In that sense, hitting Iranian oil fields may have been less economically damaging to global markets than the retaliatory logic it unleashed.
The Macro Fallout: Inflation, Rates, and Global Recession Risk
Even at the session’s close near $92.61 — a price that looks almost calm compared to the intraday extremes — Brent had risen roughly 36 percent year-to-date, according to LSEG data. The average US gasoline price had jumped approximately 50 cents in a single week. Central banks, already grappling with the inflationary legacy of Trump’s tariff regime, were now facing an energy shock on top. The Federal Reserve, which had been tentatively considering rate cuts, was being pushed firmly back into a holding pattern.
Asian equity markets reflected the anxiety: Japan’s Nikkei fell more than 5 percent, South Korea’s KOSPI dropped 6 percent. European indices opened lower. Economies most dependent on Gulf oil imports — China, India, South Korea, Japan — faced the sharpest pressure, with governments forced to choose between allowing energy inflation to run or implementing costly subsidies that would worsen already strained fiscal positions. Qatar’s energy minister warned plainly that the war could “bring down the economies of the world” if it persisted.
Rystad Energy estimated that if current disruption persisted for two months, Brent would settle above $110 per barrel. A four-month disruption scenario pointed to $135. The American Action Forum noted that a combination of sustained Strait closure and damaged Gulf infrastructure could trigger a global recession — not because of the oil shock alone, but because of the cascading impact on trade finance, supply chains, and sovereign credit in energy-dependent emerging markets.
What the Chart Actually Tells Us
Strip away the geopolitical narrative and look at the candlestick structure on that five-minute Brent chart. The early-session low around $84 per barrel represents the market’s absolute worst-case pricing before the initial surge. The spike to $119.50 represents pure fear premium — the price of uncertainty about whether the entire Persian Gulf energy ecosystem would remain functional. The violent reversal to the $85-$88 range represents the market’s partial rationalisation: that governments would intervene, that pipelines existed as partial alternatives, that the US Strategic Petroleum Reserve had not yet been deployed, and that Trump’s rhetoric suggested he wanted the war brief.
The close near $92.61 — up 1.71 percent on the official session — was almost comically prosaic given what had transpired intraday. But it revealed something important about modern energy markets: they are simultaneously hypersensitive to geopolitical shock and rapid in their ability to reprice when concrete countermeasures emerge. The era of weeks-long oil price spikes driven by Middle East conflict — as seen in 1973, 1979, and 1990 — may have given way to something far more volatile in the short term but faster-resolving, driven by algorithmic trading, real-time information, and the depth of US domestic shale production as a structural backstop.
History Written in Candlesticks
The chart of March 9, 2026 will endure not because it marked the permanent beginning of a new oil price era, but because it captured, in five-minute increments, the full arc of human fear and rational recovery in a single session. From the opening surge that sent Brent past $119 for the first time since the Ukrainian war years, to the crashing reversal as G7 ministers and OPEC+ moved to stabilise, to the anticlimactic close just north of $92 — the entire drama of geopolitical risk premium, market psychology, and policy response was compressed into a few hours of trading.
What comes next will depend on whether the Strait of Hormuz reopens, whether Gulf infrastructure survives intact, and whether the war in Iran moves toward the “unconditional surrender” Trump has demanded or settles into a prolonged stalemate. The oil market will price each development in real time, with the same ferocity it displayed on March 9. But for now, the chart stands as a monument to one of the most extraordinary single sessions in the history of commodity trading — a day when geopolitics and energy markets collided with a force that shook every trading floor on the planet.
FAQ
- Why did oil prices spike so sharply on March 9, 2026?
Oil prices surged after Israeli strikes targeted Iranian oil infrastructure, raising fears that the conflict could disrupt Persian Gulf energy exports. Traders quickly priced in the risk of a major supply shock affecting global oil markets. - Why did oil prices fall after initially rising above $119?
Prices reversed after governments signalled potential releases from strategic petroleum reserves and OPEC members pledged to increase production. These actions reassured markets that emergency supply measures could offset disruptions. - Why is the Strait of Hormuz so important for oil markets?
The Strait of Hormuz handles roughly one fifth of global oil shipments. Many Middle Eastern producers rely on this narrow waterway for exports, making it one of the most critical chokepoints in the global energy system. - Could this crisis trigger a global recession?
If disruptions to Gulf energy supply persist for months, oil prices could rise significantly, increasing inflation and slowing economic growth. Prolonged energy shocks have historically contributed to global recessions. - What does this event mean for future energy markets?
The crisis highlights the ongoing importance of geopolitical risk in oil markets. Investors and policymakers are likely to focus more on energy security, supply diversification, and the stability of critical shipping routes.
_06_12_2026_23_00_13_327450.jpg)


 Please wait processing your request...