
Image source: Shutterstock
Highlights
- Political shifts and pro-crypto policies fuel a surge in digital coin prices, with Bitcoin reaching USD 100,000 this month.
- Cryptocurrency-focused ETFs including BITW, BTF, and WGMI provide diversified exposure to the digital economy, simplifying crypto investments.
- ETFs such as BITW (+202.72% YTD returns), BTF (+90.30% YTD returns), and WGMI (+52% YTD returns) highlight the momentum in the crypto market.
Bitcoin has reached a significant milestone, surpassing USD 100,000 for the first time this month, driven by a shift in political winds following the U.S. presidential election. The victory of Donald Trump, who has promised to transform America into "the crypto capital of the planet," has fueled the surge in digital coin prices.
For investors seeking exposure to the rapidly expanding digital economy, cryptocurrency exchange-traded funds (ETFs) have become a popular option. These ETFs invest directly in cryptocurrencies or companies involved in the digital asset space, offering an easier entry point for those who want to avoid the complexities of crypto exchanges and digital wallet management.
This article highlights three crypto-focused ETFs that have delivered impressive one-year returns, averaging nearly 90%.
Bitwise 10 Crypto Index Fund ETF (BITW)
The fund tracks the Bitwise 10 Large Cap Crypto Index, offering a diversified mix of the 10 highest-valued cryptocurrencies. These assets are carefully screened for specific risks, weighted by market capitalisation, and rebalanced on a monthly basis. Bitcoin (70%) and Ethereum (17.1%) make up nearly 90% of the total value of the Index.
As of December 17, 2024, this fund has generated a YTD return of nearly 202.72% and a one-year return of 215%. Its 5-year return stands at 119%.
- NAV – USD 75.51
- Expense ratio – 2.50%
- Total assets – USD 1.5 billion
- Category – US Fund Digital Assets
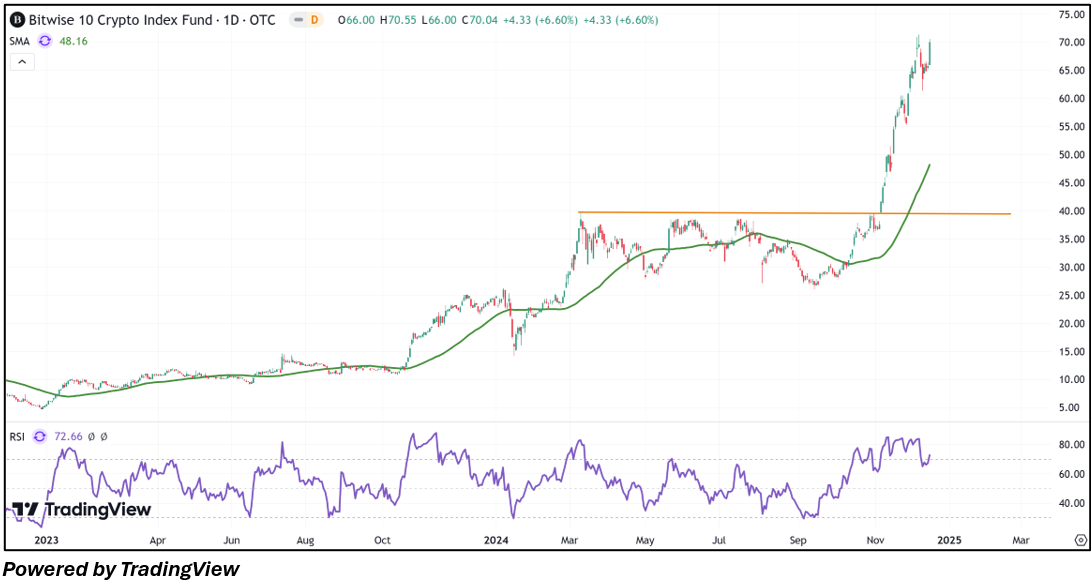
BITW’s Technical Analysis
On the daily chart, the ETF price is in an uptrend, showing higher highs and higher lows, indicating a positive bias. Moreover, the 14-period RSI is trading above its midpoint, providing further support for the previous analysis. The price is above both the 21-period and 50-period SMAs, suggesting dynamic support levels; in contrast, the ETF’s next round level could act as a psychological resistance level. Critical support for the ETF is positioned at USD 61.30, while key resistance is set at USD 75.00.
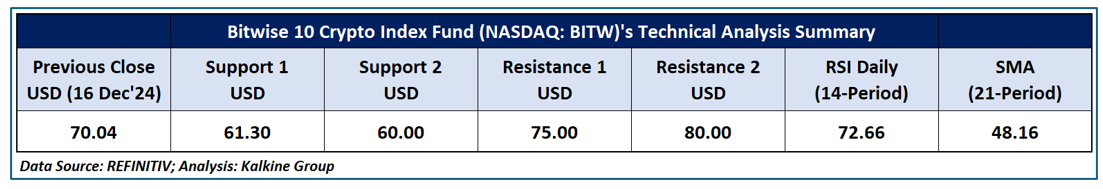
Daily Technical Chart – BITW
CoinShares Valkyrie Bitcoin and Ether Strategy ETF (BTF)
BTF primarily invests in Bitcoin and Ether futures contracts, with remaining assets allocated to high-quality securities, including U.S. Treasuries and corporate bonds. This focus provides exposure to the leading edge of blockchain technology.
As of December 13, 2024, BTF has a YTD return of 90.30% and a yearly return of 88.38% with a three-year return of 17.63%. (https://finance.yahoo.com/quote/BTF/)
- Inception date – 10/21/2021
- Total expense ratio – 1.24%
- AUM (as of December 13, 2024) – USD 58.145 million
- NAV – USD 25.01
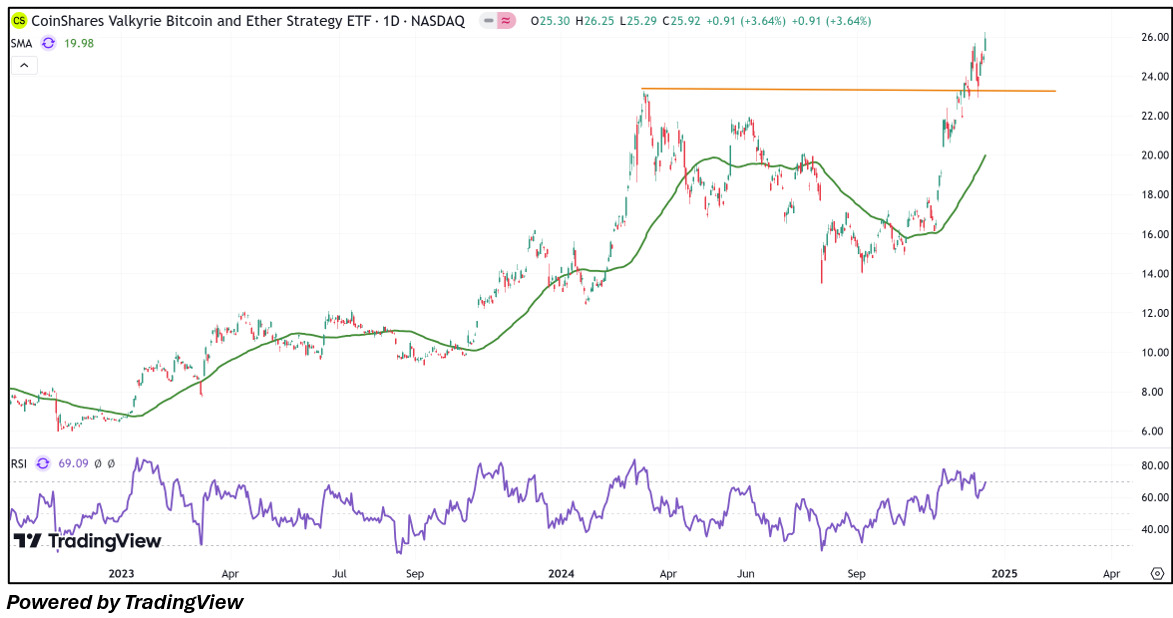
BTF’s Technical Analysis
On the daily chart, BTF broke above a significant resistance level established by the March 2024 high, signaling a positive trend. Additionally, the 14-period RSI is trading above its midpoint, adding further evidence to the previous observation. Prices are trading above both the 21-period and 50-period SMAs, which may act as dynamic support levels for the ETF; in contrast, the ETF’s historical high could function as a resistance level. Important support for the ETF is positioned at USD 23.25, while key resistance is set at USD 27.27.
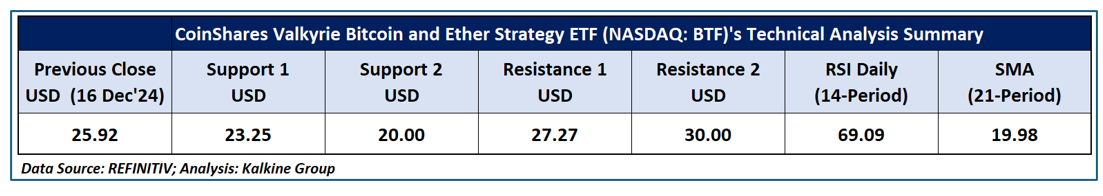
Daily Technical Chart – BTF
CoinShares Valkyrie Bitcoin Miners ETF (WGMI)
WGMI focuses on companies involved in Bitcoin mining operations. At least 80% of the fund’s net assets are allocated to securities of companies that generate at least 50% of their revenue or profits from Bitcoin mining or from providing specialized chips, hardware, software, or other services to Bitcoin mining companies.
As of December 13, 2024, the company has recorded a YTD gain of 52% and a one-year return of 91.18%.
- Inception date – 2/7/2022
- Total expense ratio – 0.75%
- AUM (as of December 13, 2024) – USD 238.97 million
- NAV – USD 27.31
- Premium/discount percentage – 0.18%
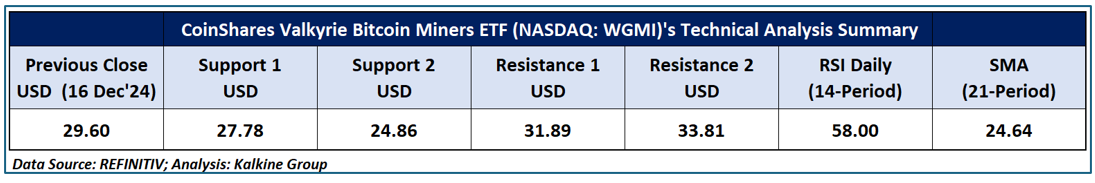
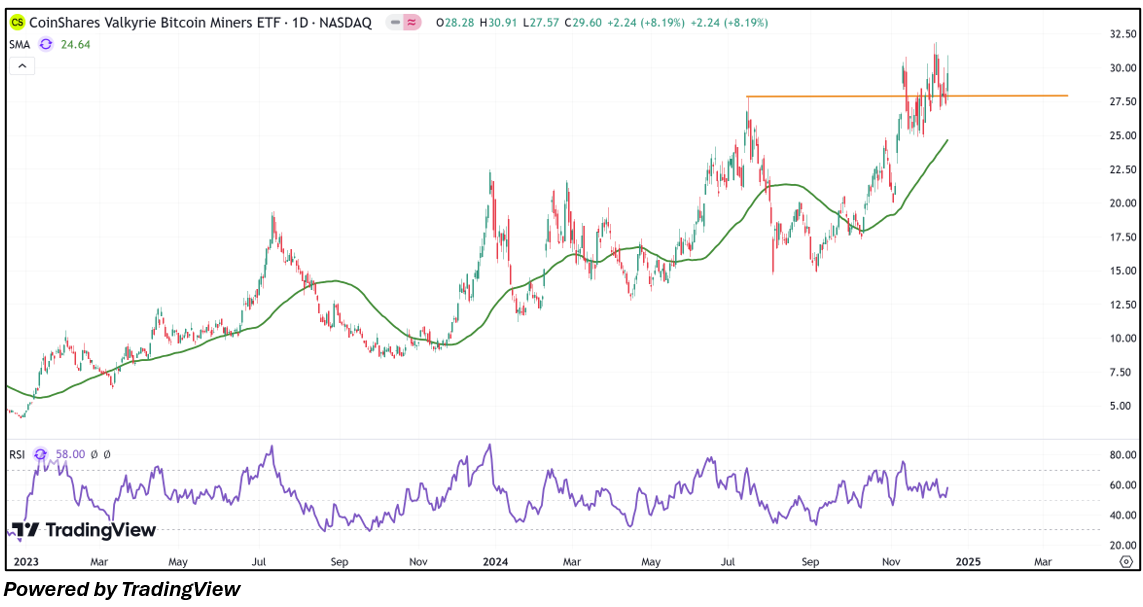
WGMI’s Technical Analysis
On the daily chart, WGMI's price broke above a significant resistance level established by the July 2024 high, indicating a positive trend. Additionally, the 14-period RSI is rebounding from its midpoint, providing further support for the recommendation. Prices are trading above both the 21-period and 50-period SMAs, which may act as dynamic support levels for the ETF; conversely, the ETF’s most recent high could function as a resistance level. Crucial support for the ETF is positioned at USD 27.78, while key resistance is set at USD 31.89.
Daily Technical Chart – WGMI
As past performance is not a reliable indicator of future performance, investors should carefully consider their individual objectives and market conditions before investing.
Technical Indicators Defined: -
Support: A level at which the stock prices tend to find support if they are falling, and a downtrend may take a pause backed by demand or buying interest. Support 1 refers to the nearby support level for the stock and if the price breaches the level, then Support 2 may act as the crucial support level for the stock.
Resistance: A level at which the stock prices tend to find resistance when they are rising, and an uptrend may take a pause due to profit booking or selling interest. Resistance 1 refers to the nearby resistance level for the stock and if the price surpasses the level, then Resistance 2 may act as the crucial resistance level for the stock.


 Please wait processing your request...