
- Semtech Corporation (NASDAQ: SMTC)
Semtech Corporation (NASDAQ: SMTC) a leading semiconductor company, specializes in the production and distribution of high-quality analog and mixed signal components. Their diverse product range caters to various industries, including high-end consumer electronics, enterprise computing, communication systems, and industrial equipment.
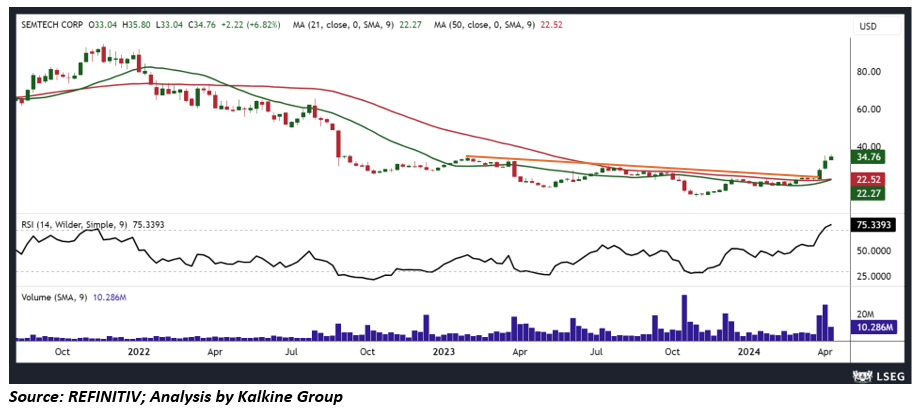
Semtech Corporation, a company in the growing semiconductor sector, has experienced increased demand, particularly in infrastructure sectors. Despite hardware constraints, the company remains optimistic about capitalizing on emerging trends. In the fourth quarter of fiscal year 2024, they reported net sales of $192.9 million, surpassing the midpoint of the projected range. Both GAAP and Non-GAAP gross margins exceeded guidance. They achieved positive operating cash flow of $13.9 million and free cash flow of $12.2 million. For the entire fiscal year 2024, net sales reached $868.8 million, with GAAP and Non-GAAP gross margins of 34.1% and 49.5%, respectively. GAAP diluted loss per share was $17.03, and Non-GAAP diluted earnings per share were $0.14. They also completed an optional credit facility prepayment of $5.0 million.
Technical View: Semtech Corporation (NASDAQ: SMTC) has experienced a breakout from a declining trendline resistance zone, accompanied by increased trading volume, suggesting a potential value increase in the near future. This price action also showcases a shift in structure, as it demonstrates the formation of higher lows on the weekly chart, indicating growing buying pressure and investor confidence. This optimistic market sentiment is further supported by the upward trend of the 14-day Relative Strength Index (RSI), which signals increasing buying pressure. Furthermore, the 21-day and 50-day Simple Moving Averages (SMAs) are approaching a bullish crossover, which not only strengthens the existing positive trend but also adds momentum to the potential rally for Semtech Corporation's stock.
- Ncino, Inc. (NASDAQ: NCNO)
Ncino, Inc. (NASDAQ: NCNO) is a company that offers cloud-based software solutions for financial institutions globally. Their primary product, the nCino Bank Operating System, is a cloud platform designed to simplify and automate complex processes. It employs data analytics, AI, and ML to assist financial institutions in onboarding clients, managing loans throughout their life cycle, opening deposit accounts, and ensuring regulatory compliance.
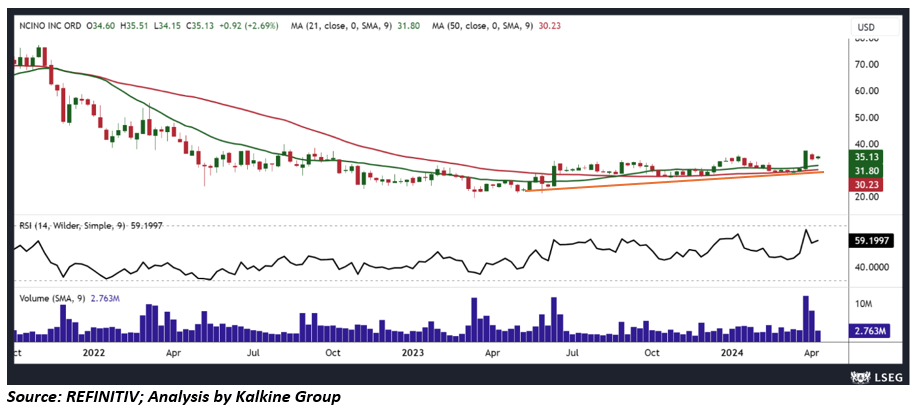
In Q4 of fiscal 2024, nCino's total revenues increased by 13% to $123.7 million, with subscription revenues up 16% to $107.5 million. GAAP loss from operations improved, and non-GAAP operating income rose significantly. GAAP net income also increased, while non-GAAP net income more than doubled. The RPO increased by 9%, and cash reserves stood at $117.4 million.
Technical View: The NCNO stock has demonstrated notable strength and resilience on its weekly chart, particularly at crucial rising trendline support points. Following the Q4 earnings that surpassed expectations, the stock experienced a strong bullish breakout, indicating a potential bottoming-out phase. This significant upward movement is further supported by the 14-period Relative Strength Index (RSI) remaining in a positive region. Currently, the stock price trades above both the 21-period and 50-period Simple Moving Averages (SMA), which may function as dynamic support levels in the future.
Note 1: How to Read the Charts?
The Green colour line reflects the 21-period moving average while the red line indicates the 50-period moving average. SMA helps to identify existing price trends. If the prices are trading above the 21-period and 50-period moving average, then it shows prices are currently trading in a bullish trend.
The Black colour line in the chart’s lower segment reflects the Relative Strength Index (14-Period) which indicates price momentum and signals momentum in trend. A reading of 70 or above suggests overbought status while a reading of 30 or below suggests an oversold status.
The Blue colour bars in the chart’s lower segment show the volume of the stock. The volume is the number of shares that changed hands during a given day. Stocks with high volumes are more liquid than stocks with lesser volume and liquidity in stocks helps in easier and faster execution of the order.
The Orange colour lines are the trend lines drawn by connecting two or more price points and used for trend identification purposes. The trend line also acts as a line of support and resistance.
Technical Indicators Defined: -
Support: A level at which the stock prices tend to find support if they are falling, and a downtrend may take a pause backed by demand or buying interest.
Resistance: A level at which the stock prices tend to find resistance when they are rising, and an uptrend may take a pause due to profit booking or selling interest.


 Please wait processing your request...