
Key Highlights
- Uranium Energy Corp is trading below key moving averages, signaling sustained downside pressure
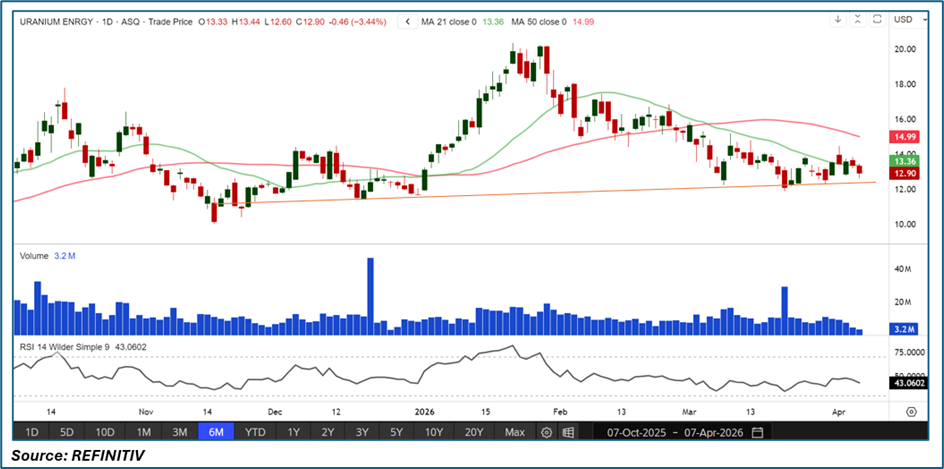
• Price action shows a steady downtrend following a failed recovery attempt
• Lower highs and weak rebounds indicate fading bullish momentum
• RSI remains below the midpoint, reflecting weak buying interest
• Long-term support trendline is being tested, increasing risk of breakdown
Trend Structure: Downtrend Intact with Lower High Formation
UEC’s chart reflects a clear downtrend structure following its peak earlier in the period. The stock attempted a recovery but failed to sustain gains, forming a sequence of lower highs and lower lows.
This pattern highlights:
• Sellers maintaining control
• Bulls unable to reclaim momentum
• Increasing probability of continuation to the downside
The inability to revisit prior highs reinforces the bearish structure currently in play.
Price Action: Gradual Drift Lower Signals Weak Demand
Recent price behavior shows:
• A controlled but persistent decline
• Small-bodied candles with limited upside follow-through
• Lack of strong bullish reversals
This type of price action typically indicates:
• Weak demand rather than panic selling
• Distribution phase where sellers gradually dominate
Unless buyers step in decisively, the drift lower may continue.
RSI Momentum: Sub-50 Reflects Bearish Lean
The 14-period RSI is hovering around 43, below the neutral 50 level:
• Indicates bearish momentum bias
• Suggests buyers lack strength to push prices higher
• No clear oversold condition yet, leaving room for further downside
This positioning aligns with the ongoing downward pressure in price.
Moving Average Analysis: Strong Overhead Resistance
UEC remains below both key moving averages:
• 21-day moving average (~13.36) acting as near-term resistance
• 50-day moving average (~14.99) reinforcing a stronger resistance zone above
Key observations:
• Price repeatedly fails to hold above the 21-day MA
• The 50-day MA caps broader recovery attempts
• Downward slope of the 50-day MA confirms trend weakness
These moving averages continue to act as dynamic resistance barriers.
Support Structure: Trendline Under Pressure
A rising long-term trendline (near ~$12.90) is currently being tested:
• Acts as critical support zone
• Multiple touches increase its importance
• A breakdown could accelerate downside momentum
Failure to hold this level may trigger:
• Increased selling pressure
• A shift into a deeper corrective phase
Market Structure: Bearish Continuation Risk Building
The broader setup reflects:
• Weak price structure beneath resistance
• Lack of strong bullish catalysts
• Persistent selling into rallies
This combination suggests a bearish continuation bias, unless key resistance levels are reclaimed.
Key Technical Scenarios
- Continued Downside Movement (Primary Scenario)
If current conditions persist:
• Price may break below trendline support (~12.90)
• Downside could extend toward lower support zones
• Moving averages likely to cap rebounds - Short-Term Consolidation
If support holds:
• Price may trade sideways between ~$12.90–$13.50
• RSI may stabilize near current levels
• Market awaits a clearer directional catalyst - Bullish Reversal Attempt (Less Likely Near-Term)
If buyers regain control:
• Break above 21-day MA could trigger short-term bounce
• Sustained move above 50-day MA needed to shift trend
• Would invalidate immediate bearish bias
Risk Considerations
- Support trendline breakdown could trigger sharp selling
• RSI is not oversold, leaving room for further downside
• False breakdowns or short squeezes remain possible
• Broader uranium sector sentiment may influence price action


 Please wait processing your request...