
Key Highlights
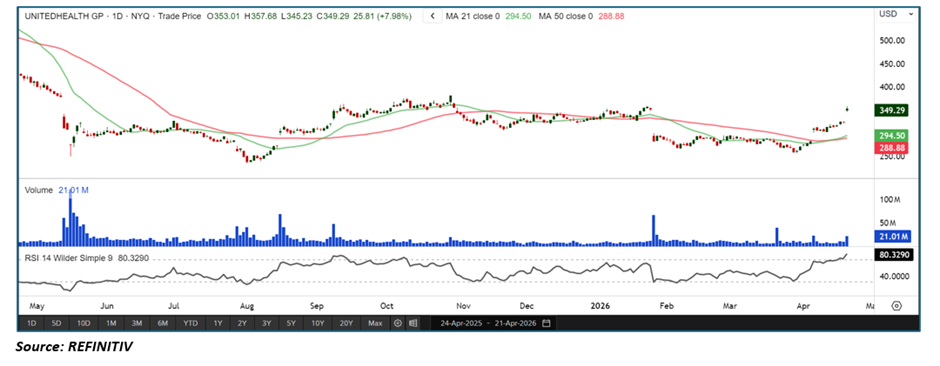
- UnitedHealth has sharply rebounded, breaking above both 21-day (~$294.50) and 50-day (~$288.88) SMAs
• Price shows a strong bullish surge following a prolonged downtrend and base formation
• RSI is above ~80, indicating overbought but powerful momentum
• Volume has expanded on the recent rally, confirming strong participation
• Recent earnings beat and raised guidance are acting as key catalysts
Trend Structure: From Downtrend to Recovery Phase
UNH is transitioning from a prolonged corrective phase into a potential recovery trend.
Key observations include:
• Extended prior downtrend through late 2025–early 2026
• Base formation followed by a sharp upside breakout
• Early signs of higher highs emerging
This suggests the stock may be entering an early-stage trend reversal after a difficult period marked by declining performance .
Price Action: Strong Breakout with Expansion Move
Recent price behavior reflects aggressive bullish momentum:
- Sharp rally with a large bullish candle
• Break above key resistance and consolidation range
• Strong follow-through buying
This implies:
• Buyers are stepping in aggressively
• Market is reacting positively to improved fundamentals
• Momentum-driven breakout is underway
Moving Averages: Bullish Reclaim of Key Levels
The moving average structure has turned constructive:
- Price has reclaimed the 21-period SMA (~$294.50)
• Price is holding above the 50-period SMA (~$288.88)
• Both averages now act as dynamic support
Interpretation:
• Short-term trend has flipped bullish
• Medium-term trend is stabilizing
• Sustained hold above these levels confirms strength
Momentum Indicators: RSI in Overbought Territory
RSI is signaling strong but stretched momentum:
- RSI above ~80, indicating overbought conditions
• Sharp momentum expansion following breakout
• No clear bearish divergence yet
Interpretation:
• Momentum is very strong
• Short-term pullback or consolidation is likely
• Overbought in reversals can persist during strong trends
Volume Analysis: Breakout Supported by Participation
Volume confirms the strength of the move:
- Noticeable spikes during breakout sessions
• Increased participation vs prior consolidation
• No clear distribution signals yet
This indicates:
• Institutional buying interest is returning
• Breakout has stronger conviction
• Market confidence is improving after recent earnings
Market Structure: Early-Stage Reversal with Momentum Expansion
The broader structure suggests a shift in trend:
- Downtrend appears to be ending
• Base formation has completed
• Breakout phase is underway
This combination often signals:
• Transition from accumulation to markup
• Early-stage recovery trend
• Potential for sustained upside if confirmed
Key Technical Levels & Scenarios
Support Levels
- ~$295 (21-day SMA — first support)
• ~$285–290 (50-day SMA — major support)
• Prior base zone (~$260–270)
Resistance Levels
- ~$360 (recent high zone)
• Psychological resistance above $400
• Previous major highs (~$450+)
Scenarios
- Bullish Continuation (Primary Case)
• Price holds above 21 & 50 SMAs
• RSI stabilizes in 60–75 range after cooling
• Continuation toward $360+ and higher resistance - Healthy Pullback / Consolidation (Likely Near-Term)
• RSI cools from overbought levels
• Price retests $300–310 zone
• Sideways consolidation before next move - Failed Breakout (Risk Scenario)
• Price falls back below 21 SMA
• RSI drops below 50
• Return to prior consolidation range
Conclusion: Breakout Recovery Backed by Fundamentals, But Short-Term Stretch Risk
UnitedHealth is showing a strong technical and fundamental recovery, supported by a breakout above key moving averages, improving momentum, and a positive earnings catalyst. The recent surge follows a difficult period for the stock, with improving cost control and guidance helping restore investor confidence


 Please wait processing your request...