
Image source: © 2025 Krish Capital Pty.Ltd
Highlights
- Aerospace and defense ETFs provide diverse exposure to a sector vital for national security and innovation.
- As of June 2025, ITA has gained nearly 31% year-to-date.
- PPA tracks the SPADE™ Defense Index, offering broader industry coverage across defense, homeland security, and space.
- PPA has delivered a one-year return of 38.72% and holds Boeing, GE, RTX, and Lockheed Martin as top positions.
- XAR uses an equal-weight strategy, reducing concentration risk compared to more top-heavy peers.
The aerospace and defense sector plays a critical role in national security, advanced manufacturing, and technological development. Exchange-traded funds (ETFs) such as ITA, PPA, and XAR provide access to this specialized segment through varied strategies and portfolio compositions. These funds reflect different approaches to capturing the performance of U.S.-based aerospace and defense companies, including exposure to aircraft producers, defense contractors, and suppliers across both commercial and military domains.
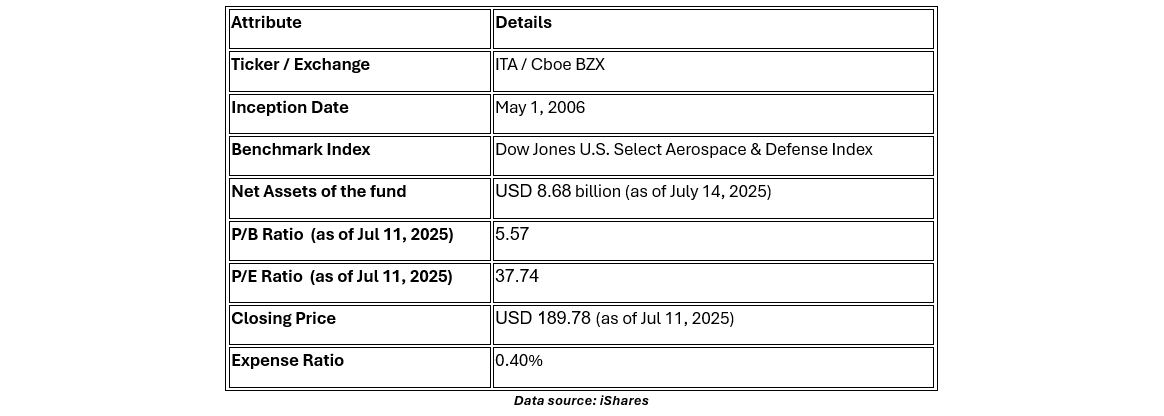
iShares U.S. Aerospace & Defense ETF (ITA)
The iShares U.S. Aerospace & Defense ETF (ITA) offers targeted exposure to the U.S. aerospace and defense industry, a sector closely tied to national security, technological innovation, and government spending trends. Managed by BlackRock, ITA seeks to track the performance of the Dow Jones U.S. Select Aerospace & Defense Index, investing in leading companies that design, manufacture, and support aircraft, defense systems, and related technologies.
Price Performance and Top Holdings
As of June 30, 2025, ITA has posted notable gains, achieving annualized returns of roughly 25% over three years and 19% over five years. Year-to-date, the fund is up nearly 31%.
ITA holds a focused portfolio of around 38 stocks. Its largest positions include GE Aerospace at nearly 20.35% of assets, followed by RTX Corp at 14.66%, and Boeing at 9.42%. Together, these leading companies account for nearly half of the fund’s total holdings, underscoring ITA’s emphasis on key players in the aerospace and defense industry.
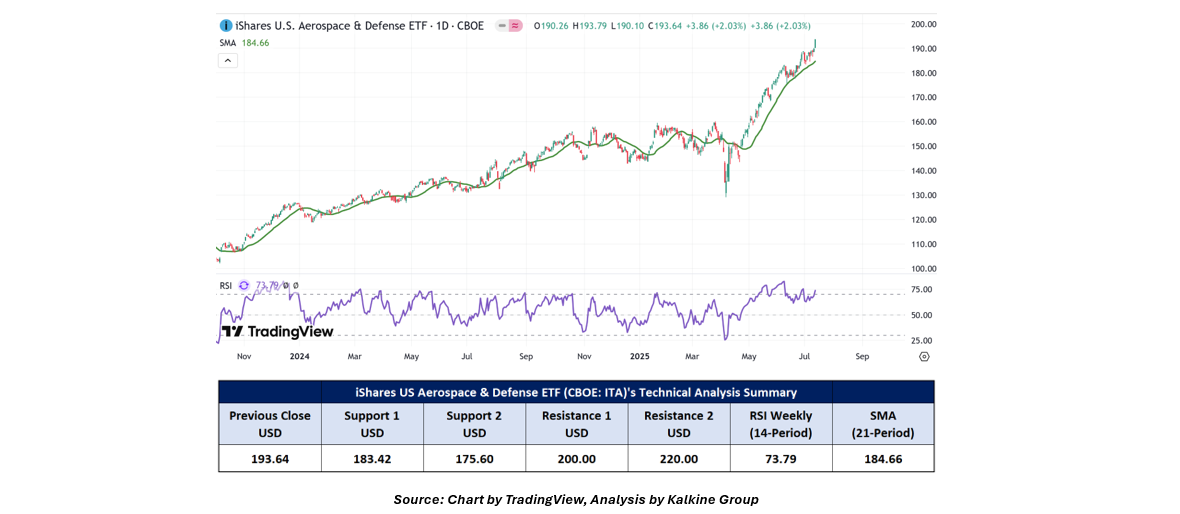
On the daily chart, ITA's ETF prices are undergoing an uptrend characterized by higher highs and higher lows, indicating a positive bias. Additionally, the 14-period Relative Strength Index (RSI) is heading north from its midpoint, reinforcing the likelihood of this scenario. Prices are trading above both trend-following indicators 21-period and 50-period SMAs, which might serve as dynamic support levels for the ETF; in contrast, the ETF’s next round level may act as a resistance. A significant support level for the ETF is positioned at USD 175.60, while critical resistance level is situated at USD 200.00.
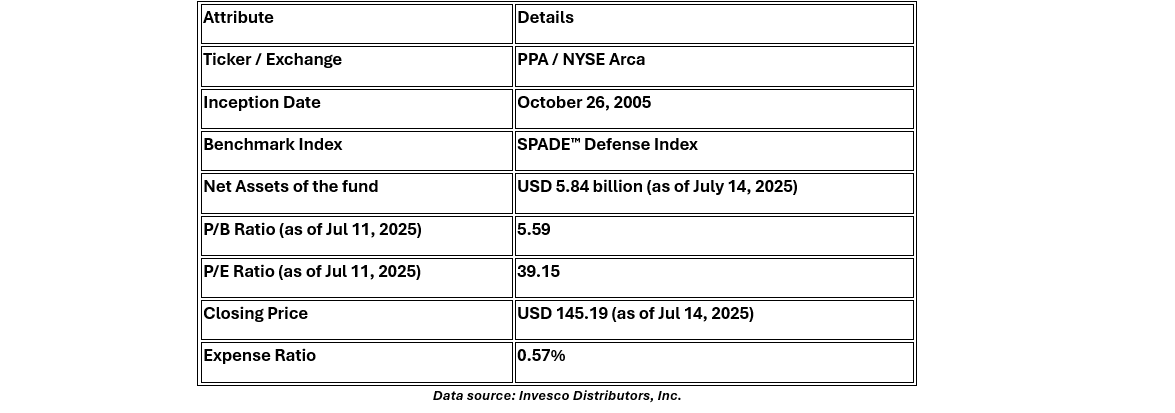
Invesco Aerospace & Defense ETF (PPA)
The Invesco Aerospace & Defense ETF (PPA) provides exposure to U.S. companies involved in the development, manufacturing, operations, and support of products and services related to aerospace and defense. The fund seeks to track the SPADE™ Defense Index, which includes companies across defense, homeland security, and space industries. Managed by Invesco, PPA offers investors an opportunity to access this specialized sector through a single, diversified ETF.
Price Performance and Top Holdings
As of June 30, 2025, PPA has delivered positive returns, with a one-year NAV growth of about 38.72% and annualized returns of approximately 27.20% over three years and 21.42% over five years. Year-to-date, the fund has gained roughly 23.45%.
PPA maintains a diversified portfolio of 58 holdings as of July 11, 2025. Its largest allocations include Boeing, General Electric Co, RTX Corp, and Lockheed Martin, each representing 8.42%, 7.88%, 7.39%, and 7.17% within the fund.
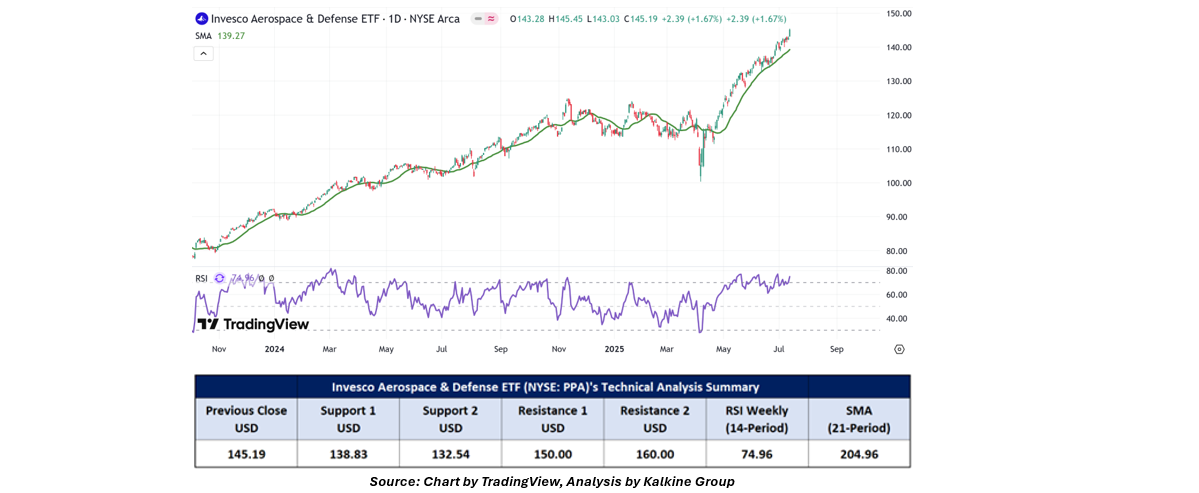 On the daily chart, PPA's ETF prices are undergoing an uptrend characterized by higher highs and higher lows, indicating a positive bias. Additionally, the 14-period Relative Strength Index (RSI) is heading north from its midpoint, reinforcing the likelihood of this scenario. Prices are trading above both trend-following indicators 21-period and 50-period SMAs, which might serve as dynamic support levels for the ETF; in contrast, the ETF’s next round level may act as a resistance. A significant support level for the ETF is positioned at USD 132.54, while critical resistance level is situated at USD 150.00.
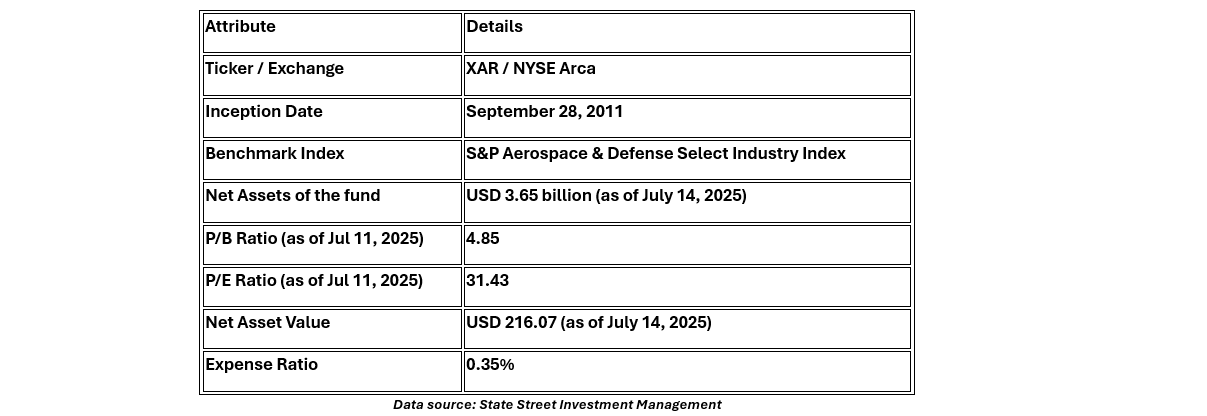
SPDR® S&P® Aerospace & Defense ETF (XAR)
The SPDR® S&P® Aerospace & Defense ETF (XAR) offers focused exposure to the U.S. aerospace and defense industry by tracking the S&P Aerospace & Defense Select Industry Index. Unlike some peers that are heavily weighted toward the largest firms, XAR uses an equal-weight strategy, giving balanced exposure to both large and smaller companies across the sector. Managed by State Street Global Advisors, the fund captures businesses involved in manufacturing, assembling, and distributing aerospace and defense equipment, components, and services.
Price Performance and Top Holdings
As of June 30, 2025, XAR has posted a 10.09% gain over the past month and has risen 31.12% for the current quarter. Year-to-date, the fund is up 27.52%, while its one-year return stands at 51.49%.
XAR’s portfolio consists of 39 holdings spread equally across large, mid, and smaller companies, reducing concentration risk in any single name. The top three holdings as of July 11, 2025, are Rocket Lab Corp (4.58% of assets), AeroVironment Inc (4.46%), and Kratos Defense & Security (4.11%).
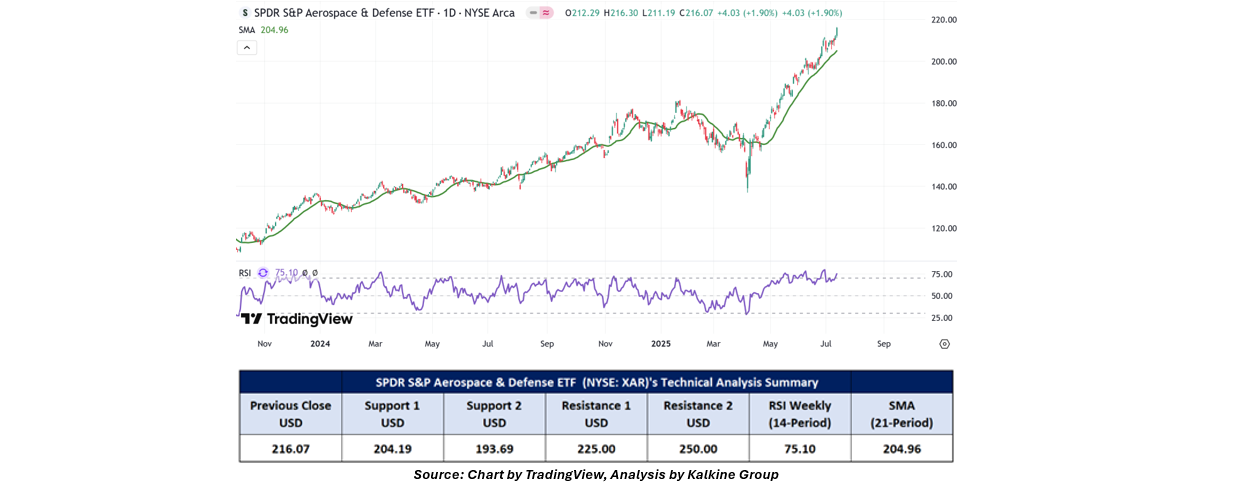 On the daily chart, XAR's ETF prices are undergoing an uptrend characterized by higher highs and higher lows, indicating a positive bias. Additionally, the 14-period Relative Strength Index (RSI) is heading north from its midpoint, reinforcing the likelihood of this scenario. Prices are trading above both trend-following indicators 21-period and 50-period SMAs, which might serve as dynamic support levels for the ETF; in contrast, the ETF’s next round level may act as a resistance. A significant support level for the ETF is positioned at USD 193.63, while critical resistance level is situated at USD 250.00.
However, it's important to remember that past performance is not a reliable indicator of future results. When selecting an ETF, it's essential to consider individual sector preferences, risk tolerance, and the specific performance of the underlying index.
Technical Indicators Defined: -
Support: A level at which the stock prices tend to find support if they are falling, and a downtrend may take a pause backed by demand or buying interest. Support 1 refers to the nearby support level for the stock and if the price breaches the level, then Support 2 may act as the crucial support level for the stock.
Resistance: A level at which the stock prices tend to find resistance when they are rising, and an uptrend may take a pause due to profit booking or selling interest. Resistance 1 refers to the nearby resistance level for the stock and if the price surpasses the level, then Resistance 2 may act as the crucial resistance level for the stock.
Abbreviations
CMP: Current Market Price
SMA: Simple Moving Average
RSI: Relative Strength Index


 Please wait processing your request...