_05_06_2026_03_42_14_157830.jpg)
Key Momentum Highlights
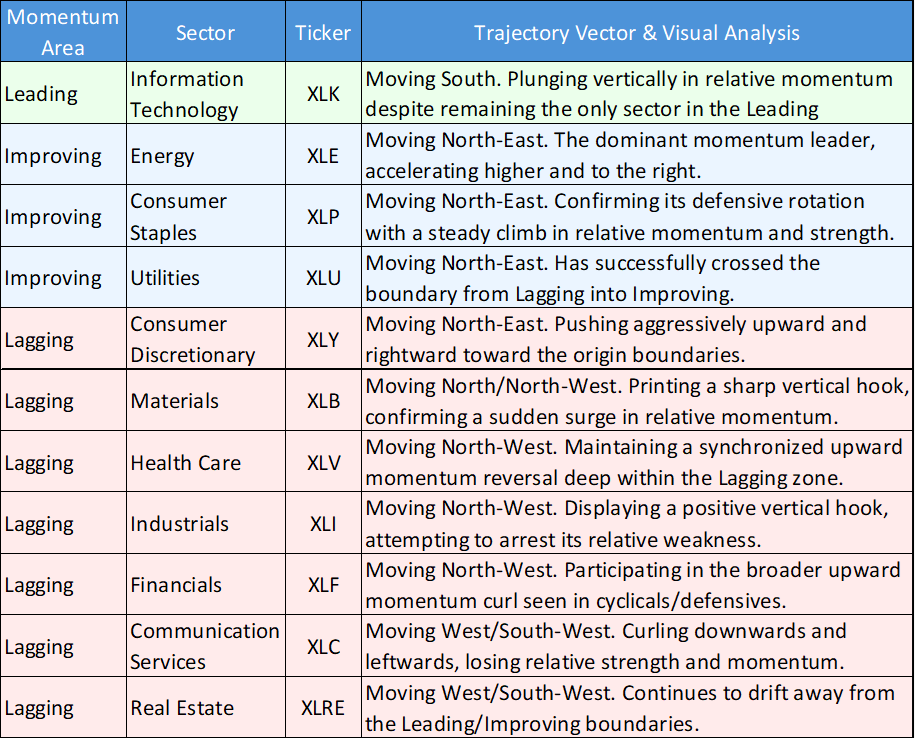
- Tech's Momentum Collapse: Information Technology (XLK) remains the sole occupant of the Leading quadrant, but its trajectory has taken a violent turn South, indicating a severe contraction in relative momentum despite positive absolute daily returns.
- Utilities Break Out: Utilities (XLU) officially crossed the horizontal boundary from Lagging into the Improving quadrant, joining Energy (XLE) and Consumer Staples (XLP) in a confirmed accumulation trend.
- Cyclical Bottoming: Materials (XLB) and Industrials (XLI) are printing sharp vertical hooks within the Lagging quadrant, signaling a sudden and aggressive positive reversal in relative momentum.
- Energy's Unyielding Ascent: Energy (XLE) remains the chart's absolute momentum outlier, pushing higher and further to the right deep within the Improving space.
The US equity market session on May 5, 2026, presented a textbook example of the divergence between absolute price action and relative momentum. While the daily tape was dominated by a massive "risk-on" rally led by Information Technology, the Relative Rotation Graph (RRG) paints a fundamentally different picture. The structural momentum data confirms that the market's underlying gravity continues to rotate away from historical tech leaders and toward defensive proxies, inflation hedges, and beaten-down cyclical value.
Sector Momentum and Trajectory Summary
The following chart and table detail the momentum quadrant positioning and visual trail vectors for the 11 major US S&P 500 sectors as of the May 5 close:
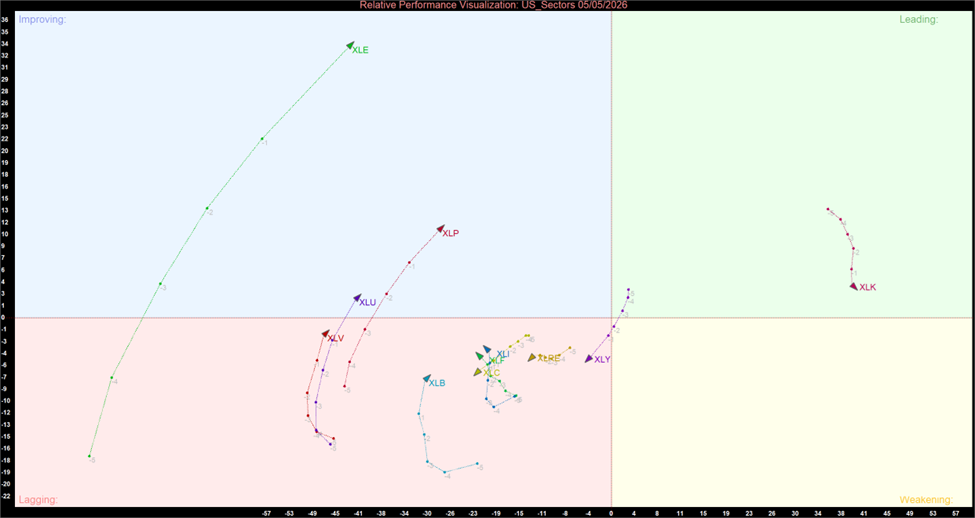
US Sector Relative Momentum Chart (at the closing price of 05/05/2026). Powered by: amibroker.com
Quantitative Momentum Themes
The Tech Leadership Illusion
Information Technology (XLK) logged a massive +2.21% gain on the day, but its RRG vector is the most alarming on the board. The trail has hooked sharply South, indicating that its relative momentum against the S&P 500 is in freefall. This quantitative metric suggests that the daily tech rally was more likely a product of short-term short-covering or passive flow rather than a resumption of structural, long-term leadership.
The Defensive Breakout Broadens
The defensive rotation is no longer isolated to just Consumer Staples (XLP). Utilities (XLU) provided critical confirmation on May 5 by officially crossing the zero-line into the Improving quadrant. Supported by a steady North-East trajectory, this transition confirms that institutional capital is systematically accumulating yield-proxies, favoring stable, regulated cash flows over high-beta growth.
Cyclicals Print a Vertical Reversal
After suffering severe technical damage in recent sessions, the physical economy sectors are showing signs of life. Materials (XLB), which saw a strong +1.74% absolute gain, printed a sharp, almost vertical Northward hook on the RRG. Alongside Industrials (XLI) and Financials (XLF), this "North-West hook" cluster within the Lagging quadrant signifies that downside momentum has exhausted, and a relative bottoming process is actively underway.
Bottom Line
Momentum data from May 5 demands that active managers look past the headline tech rally. The severe Southward plunge in XLK’s relative momentum serves as a stark warning against chasing mega-cap growth at current levels. Instead, the quantitative evidence heavily favors a continued allocation toward the Improving quadrant—specifically the unyielding momentum of XLE, and the confirmed defensive accumulation in XLP and XLU. Furthermore, the sharp vertical hooks from XLB and XLI suggest that cyclical value is beginning to catch a structural bid, offering early accumulation opportunities for those front-running a broader economic stabilization trade.


 Please wait processing your request...