
Key Momentum Highlights
- XLK Reclaims True Macro Leadership: Information Technology (XLK) has successfully absorbed its localized distribution trail. The sector has crossed above the horizontal baseline into the Leading quadrant, maintaining a steady North-East vector and providing a secure structural foundation for the broader index.
- The Thematic Improving Crowd: A massive seven-sector block spanning Cyclicals (XLI, XLRE), Value (XLF, XLB), Growth (XLC, XLY), and Yield (XLU) is traveling along highly correlated, parallel North-East vectors inside the Improving quadrant. This structural footprint points to a broad, programmatic Equity sweep across the left hemisphere.
- The Energy Mean-Reversion Paradox: Despite leading the absolute performance board with a robust +1.29% gain, Energy (XLE) remains structurally trapped inside the Lagging quadrant. Its sharp North-East trajectory represents a high-velocity recovery hook within a larger technical downtrend rather than an unvetted structural expansion.
- Health Care Acts as the Primary Funding ATM: Positioned near the apex of the Improving quadrant, Health Care (XLV) is the solitary sector printing a definitive South-West/South-East rollover vector. Institutional desks are systematically harvesting Liquidity from peak pharmaceutical shields to fund the broader cyclical charge.
The empirical momentum data from the June 3, 2026 session presents a profound, market-wide structural lift where programmatic models are aggressively pulling Assets out of the doldrums. The Relative Rotation Graph (RRG) exposes a stark inversion of classic defensive behavior. Rather than running targeted sector pairs-trades, institutional Capital is executing a massive Diversification sweep, anchoring index stability in mega-cap technology while synchronously lifting cyclical value across an expansive, left-hemisphere front.
Sector Momentum and Trajectory Summary
The following chart details the momentum quadrant positioning and tracking vectors for the 11 major S&P 500 sectors following the close on June 3, 2026:
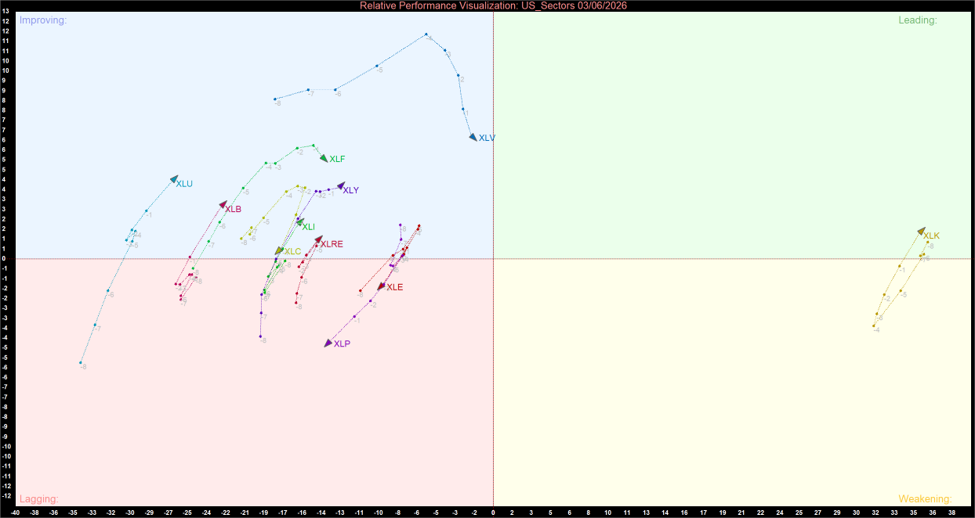
US Sector Relative Momentum Chart (at the closing price of 03/06/2026). Powered by: amibroker.com
Quantitative Momentum Themes
The Anatomy of a Momentum Paradox
The Placement of Energy (XLE) highlights the vital mathematical importance of separating absolute daily price action from underlying relative momentum. XLE’s +1.29% absolute price surge dominated the daily ledger, but its RRG coordinate reveals its true nature: a high-velocity mean-reversion counter-hook. Because its tracking trail originates deep within the distribution graveyard, the sector is burning massive short-covering energy simply to climb back toward the RS-Ratio 100 line. Tactical desks must treat the bounce as a trading range phenomenon until it clears the horizontal baseline.
The Great Left-Hemisphere Migration
The RRG grid displays an extraordinary crowding effect, with 9 out of 11 sectors packed into the upper-left hemisphere. This intense grouping proves that active managers are running a highly unified asset allocation strategy. Programmatic trading models are lifting cyclicals, financials, basic materials, and interest-rate-sensitive proxies simultaneously. This broad-based lifting of all boats effectively cushions multi-strategy portfolios against sudden single-stock index concentration shocks.
Core Tech Reclaims the Throne
Any narrative surrounding a structural tech breakdown is completely negated by the actual vector direction of Information Technology (XLK). The sector has successfully normalized its short-term downward dip and crossed back above the horizontal threshold line into the Leading quadrant. With XLK acting as the absolute right-hand anchor and accelerating North-East, the broader index maintains a highly secure structural floor.
The chart confirms that the cash driving this expansive, multi-sector cyclical advance is being extracted from a single explicit destination: Health Care (XLV). As the only sector pointing South-East and shedding vertical momentum from a position of relative strength, it is acting as the market's primary liquidity fountain.
The June 3 momentum matrix dictates a balanced, non-index-tracking posture that embraces the broader left-hemisphere lift. With the Weakening quadrant completely vacant, passive cap-weighted index exposure carries elevated concentration risk. Active managers should maintain core long exposure to the re-accelerating technology engine (XLK) for growth baseline Beta, while aggressively deploying excess tactical liquidity into the high-velocity, synchronized Improving cyclical cluster, specifically maximizing XLF, XLB, and XLI. Conversely, any bottom-fishing positions in Energy (XLE) should be governed with tight technical parameters, respecting its status as a graveyard recovery play.


 Please wait processing your request...