
Key Momentum Highlights
- The Persistent Leadership Void: For the second consecutive session, the Leading quadrant remains completely vacant. The S&P 500 continues to operate without a confirmed structural anchor, warning of elevated rotational fragility.
- The Rate-Shock Reversal: After pushing toward the threshold of market leadership yesterday, Utilities (XLU) suffered a violent structural rejection. Its trajectory violently hooked South/South-West, joining Financials (XLF) and Real Estate (XLRE) in a massive Yield-driven momentum collapse.
- Non-Yield Defensive Dominance: Health Care (XLV) and Consumer Staples (XLP) remain the undisputed momentum leaders of the tape. Both are printing aggressive North-East trajectories high within the Improving quadrant, actively accumulating vertical momentum regardless of broader market conditions.
- Tech's Dead-Cat Bounce: Information Technology (XLK) arrested its aggressive downward plunge, but remains trapped in the Weakening quadrant moving horizontally. This confirms the daily price bounce was a technical mean-reversion rather than a resumption of structural leadership.
- Cyclical Resilience: Despite tape Volatility, Industrials (XLI) and Materials (XLB) are quietly drifting East/North-East within the Improving quadrant, successfully holding onto their recent structural accumulation.
The empirical momentum data from the May 13, 2026, session captures a market desperately searching for equilibrium while being battered by competing macroeconomic forces. The Relative Rotation Graph (RRG) illustrates a tape torn between algorithmic relief-buying in beaten-down growth sectors and aggressive, panic-selling across rate-sensitive value. With the Leading quadrant entirely empty, the data dictates that the market is currently entirely transactional, driven by short-term mean-reversion and macro shocks rather than sustainable institutional conviction.
Sector Momentum and Trajectory Summary
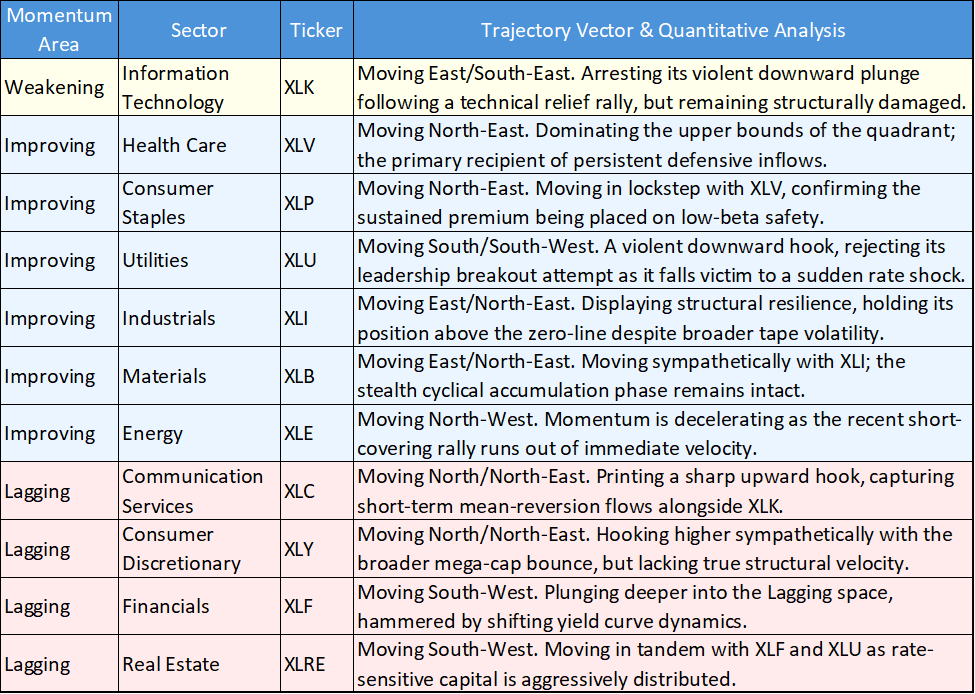
The following chart and table detail the momentum quadrant positioning and visual trail vectors for the 11 major US S&P 500 sectors based on the May 13 close:
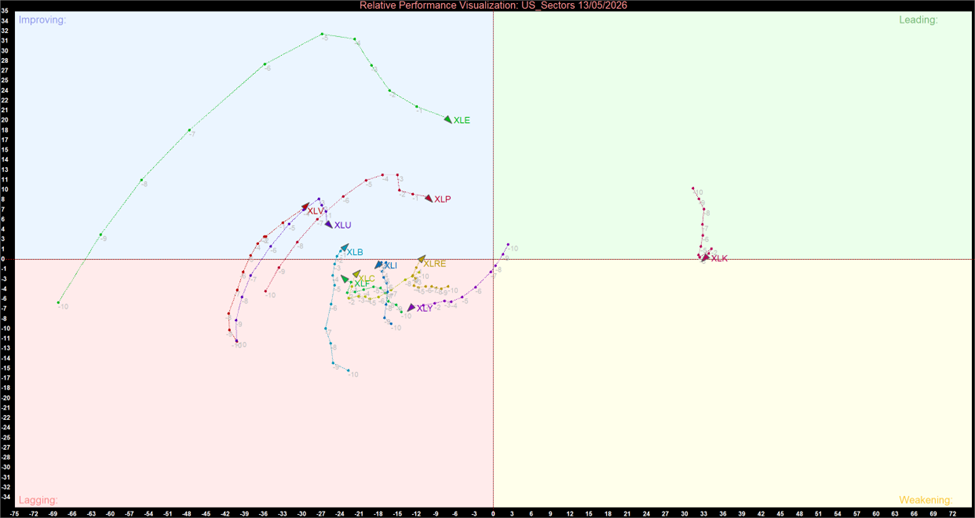
US Sector Relative Momentum Chart (at the closing price of 13/05/2026). Powered by: amibroker.com
Quantitative Momentum Themes
The Persistent Leadership Void
The most mathematically significant feature of the current market structure is the continued vacancy of the Leading quadrant. For two straight sessions, no sector has managed to simultaneously exhibit positive relative trend (RS-Ratio) and positive relative momentum (RS-Momentum). A tape without an anchor is inherently unstable. Without a confirmed leader to draw sustained, passive Capital flows, the broader index will remain highly susceptible to the violent, intraday rotational whiplash we are currently witnessing.
Rate-Shock Momentum Collapse
The RRG data captures a massive, synchronized Liquidation event across all interest-rate-sensitive sectors. Utilities (XLU) completely reversed its bullish breakout trajectory, hooking sharply South-West. Financials (XLF) and Real Estate (XLRE) plunged deeper into the Lagging abyss. When yield proxies and banks suffer this level of synchronized momentum decay, it confirms that institutional models are aggressively repricing the Bond Market, likely pivoting to a "higher-for-longer" reality that makes these capital structures immediately toxic.
True Safety vs. Yield Proxies
The defensive complex has definitively split. While XLU was destroyed by the rate shock, Health Care (XLV) and Consumer Staples (XLP) completely ignored the bond market volatility. Their trails are driving aggressively North-East toward the Leading quadrant. The empirical evidence proves that institutional capital is paying a massive premium for non-yielding, low-Beta safety. XLV and XLP are currently functioning as the market's only reliable structural bunkers.
The Mean-Reversion Trap
Active managers must exercise extreme caution regarding the relief rally in the Growth Triad. While XLK, XLC, and XLY posted solid absolute gains on the day, their momentum profiles remain deeply compromised. XLK is merely drifting horizontally in the Weakening quadrant, failing to reclaim its upward structural velocity. Meanwhile, XLC and XLY are simply hooking up from deep within the Lagging quadrant. This mathematical footprint is characteristic of a mechanical dead-cat bounce or short-covering event, not the immediate resumption of a primary uptrend.
The RRG momentum data from May 13 dictates that portfolios must remain defensively fortified and highly selective. The violent momentum collapse across XLU, XLF, and XLRE serves as a strict quantitative warning to avoid all interest-rate-sensitive equities until the bond market stabilizes. Furthermore, the structural data suggests fading the relief rally in mega-cap growth, as it currently lacks the momentum velocity required for a sustained breakout. The empirical edge remains heavily concentrated in holding true, non-yielding safety (XLV, XLP) while maintaining exposure to the surprising under-the-surface structural resilience of the physical economy (XLI, XLB).


 Please wait processing your request...