
Key Momentum Highlights
- The Utilities Dead-Cat Bounce: Despite posting a strong +0.91% absolute gain, Utilities (XLU) formally collapsed into the Lagging quadrant. This mathematical footprint confirms the daily price action is a mechanical short-covering trap devoid of true institutional accumulation.
- The Resilient Tech Anchor: Conversely, Information Technology (XLK) bled -0.64% on the tape but stubbornly maintained its position in the Leading quadrant. Its relative strength refuses to break, confirming that while Tech is being distributed, the broader market is disintegrating at a much faster velocity.
- The Absolute Stagflation Barbell: Energy (XLE) has joined XLK in the Leading quadrant, while Health Care (XLV) and Consumer Staples (XLP) dominate the Improving space. Capital is strictly isolating into Inflation hedges and non-yielding defensive fortresses.
- Cyclical Capitulation: The physical economy trade is systematically broken. Industrials (XLI) and Materials (XLB) are printing violent South-West trajectories deep within the Lagging graveyard, pricing in an unavoidable economic contraction.
The empirical momentum data from the May 19, 2026, session serves as a masterclass in why active managers must decouple their analysis from the absolute price tape. The Relative Rotation Graph (RRG) presents a market defined by extreme quantitative deception. Sectors printing strong daily gains are mathematically failing under the surface, while bleeding mega-caps are retaining their structural superiority. This zero-sum, highly polarized environment demands strict adherence to relative momentum data to avoid devastating bull traps.
Sector Momentum and Trajectory Summary
The following chart details the momentum quadrant positioning and visual trail vectors for the 11 major US S&Amp;P 500 sectors based on the May 19 close:
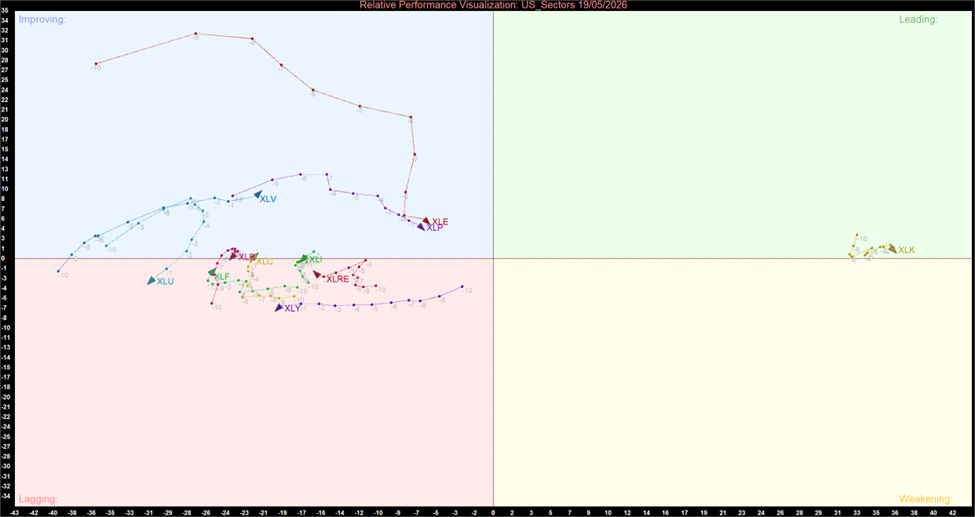
US Sector Relative Momentum Chart (at the closing price of 19/05/2026). Powered by: amibroker.com
Quantitative Momentum Themes
The Two-Way Relative Paradox
The May 19 tape provides a textbook example of extreme quantitative divergence occurring in both directions simultaneously.
- The Short-Covering Trap: Utilities (XLU) flashed bright green on standard screens (+0.91%), luring fast money into a perceived defensive rotation. However, its RRG vector actually plunged South-West into the Lagging quadrant. This divergence proves the absolute gain was entirely driven by mechanical short-covering, while true institutional relative strength is actively bleeding out.
- The Mathematical Anchor: Information Technology (XLK) closed firmly in the red (-0.64%), yet it remains anchored in the Leading quadrant above the 100-level threshold. RRG measures relative performance; the fact that XLK retains its mathematical Leadership while bleeding absolute price highlights just how catastrophically the rest of the S&P 500 is deteriorating around it.
Hardening the Stagflation Barbell
- Institutional capital is rigidly enforcing a stagflationary playbook. Energy (XLE) is driving aggressively North-East into the Leading quadrant, capturing the Alpha of raw Commodity pricing power. Simultaneously, the Improving quadrant is exclusively populated by Health Care (XLV) and Consumer Staples (XLP). With XLU falling into the Lagging space, active managers are explicitly rejecting Yield proxies in favor of pure, non-yielding, low-Beta safety.
The Graveyard Expands
- Eight of the eleven S&P 500 sectors are now trapped in the Lagging quadrant. Yesterday's localized relief bounce in Financials (XLF) aggressively rolled over into a South/South-West plunge, confirming severe structural damage from Credit and Yield Curve anxiety. Furthermore, the complete breakdown of Materials (XLB) and Industrials (XLI) solidifies the total institutional rejection of any global Manufacturing expansion thesis.
The RRG momentum data from May 19 dictates extreme tactical discipline and a total rejection of the absolute price tape. Buying the absolute strength in Utilities (XLU) is a mathematically proven trap. Active managers must remain rigidly aligned with the explicit quantitative signals: maximize the "Energy + Defensives" barbell (XLE, XLV, XLP) to capture the only existing upward relative velocity. While Information Technology (XLK) mathematically retains its anchor status, its absolute momentum bleed requires tight risk management. All other exposure in the Lagging cyclical and consumer discretionary spaces must be systematically liquidated.


 Please wait processing your request...