_05_12_2026_03_56_12_316090.jpg)
Key Momentum Highlights
- The Solitary Anchor: Information Technology (XLK) maintained its position above the threshold to remain the sole occupant of the Leading quadrant. It has officially decoupled from the broader growth complex to anchor the S&P 500 alone.
- The Triad Fractures: The historical "Growth Triad" has suffered a catastrophic structural breakdown. While XLK anchors the market, Communication Services (XLC) is plunging steeply South-West deep within the Lagging quadrant, and Consumer Discretionary (XLY) has rejected its breakout attempt, rolling over.
- Cyclical Velocity Accelerates: Materials (XLB) and Industrials (XLI) are printing aggressive North-East vectors within the Improving quadrant. The data firmly cements that the physical economy is undergoing a sustained, quantitative accumulation phase.
- Energy’s Violent Mean Reversion: Energy (XLE) printed a sharp North/North-West hook, violently arresting its multi-day structural Liquidation. This visualizes a massive influx of short-covering or bottom-fishing following recent extreme distribution.
The empirical momentum data from the May 11, 2026, session reveals a market undergoing profound internal restructuring. The Relative Rotation Graph (RRG) captures an environment devoid of broad-based Leadership. Instead, the market is characterized by extreme sector isolation. The historical correlations that have defined mega-cap growth for years have shattered, leaving pure-play technology as the solitary structural anchor while Capital rotates aggressively into beaten-down cyclicals and mean-reverting Inflation hedges.
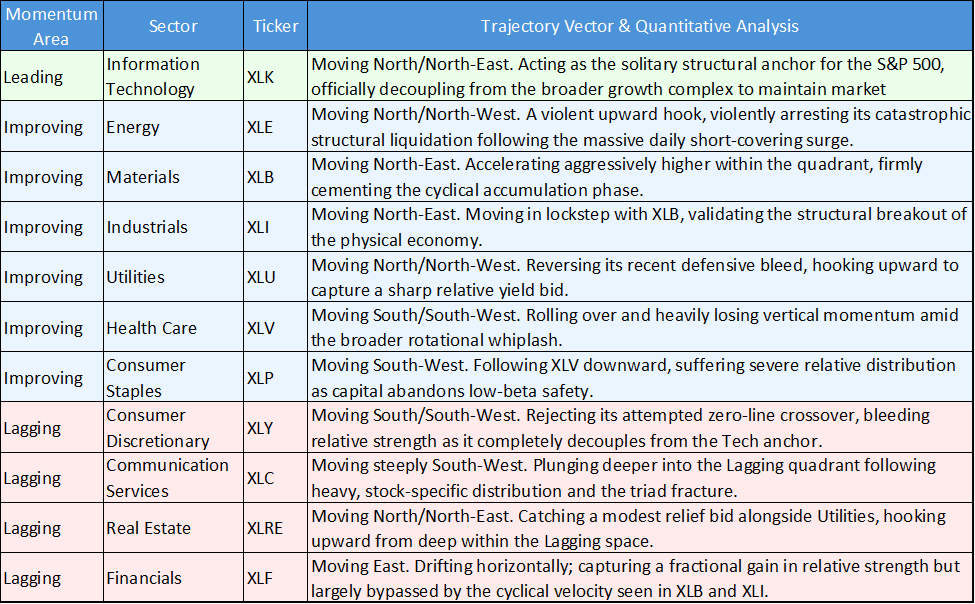
Sector Momentum and Trajectory Summary
The following table details the momentum quadrant positioning and visual trail vectors for the 11 major US S&P 500 sectors based on the May 11 close:
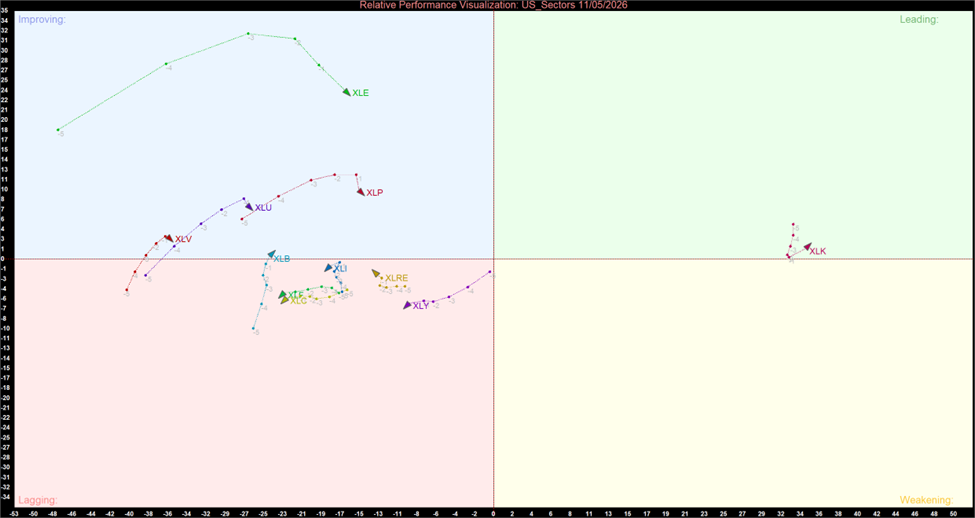
US Sector Relative Momentum Chart (at the closing price of 11/05/2026). Powered by: amibroker.com
Quantitative Momentum Themes
The Shattered Growth Triad
The most consequential quantitative signal on the board is the extreme divergence between Information Technology (XLK) and Communication Services (XLC). Historically, these sectors share a tight mathematical correlation, moving together through the RRG quadrants. The May 11 data confirms a definitive decoupling. While XLK maintained its North-East vector to remain the solitary anchor in the Leading quadrant, XLC’s trajectory collapsed, plunging South-West deep into the Lagging space. This structural fracture proves that passive, indiscriminate buying of "mega-cap growth" has ended; active managers are heavily isolating semiconductor/hardware strength from media/telecom weakness.
The Cyclical Accumulation is Cemented
Last week, quantitative tools flagged a "stealth breakout" in the cyclical complex as they crossed into the Improving quadrant. The May 11 data confirms this was not a false positive. Both Materials (XLB) and Industrials (XLI) are accelerating aggressively North-East. This continuous gain in both horizontal relative strength and vertical momentum validates that institutional capital is methodically building core positions in the physical economy, anticipating a sustained Manufacturing re-acceleration.
Energy: Dead-Cat Bounce or Structural Floor?
Energy (XLE) provided the most violent trajectory shift of the session. After days of printing steep South/South-West vectors—confirming catastrophic liquidation—its trail abruptly hooked North/North-West. While this arrests the immediate momentum bleed, active managers must view this with quantitative skepticism. Sharp, vertical hooks following massive distribution are the hallmark of short-covering rallies and mean-reversion traps, not necessarily the immediate resumption of a structural uptrend. The sector must print sustained, horizontal relative strength before a true structural floor is confirmed.
Yield Proxies vs. Safety Staples
The defensive complex is fracturing internally. Utilities (XLU) and Real Estate (XLRE) printed Northward hooks, capturing relative momentum as capital actively bid up rate-sensitive yield. Conversely, non-yielding safety sectors like Consumer Staples (XLP) and Health Care (XLV) rolled over, printing South/South-West vectors. This divergence indicates the market is placing a highly specific bet on stabilized or falling yields, rather than demonstrating a broad-based, panic-driven flight to safety.
The RRG momentum data from May 11 demands high-conviction, concentrated portfolio construction. The market is violently punishing broad-brush allocations. The structural fracture of the Growth Triad means investors can no longer use XLC or XLY as proxies for XLK's leadership. The empirical edge requires maintaining exposure to the solitary anchor of pure-play Tech (XLK), while actively participating in the confirmed, quantitative accumulation of the physical economy (XLI, XLB). Energy (XLE) remains a highly volatile mean-reversion trade that requires strict risk management until the momentum data confirms a durable structural floor.


 Please wait processing your request...