
Key Highlights
- S&P 500, Nasdaq and Dow fall below 200-day EMA
- RSI weakens near 40, indicating fading momentum
- Macro pressures weigh on equity market sentiment
- Technical breakdown signals shift in market regime
- Investors turn cautious amid rising uncertainty
Introduction: A Market Losing Momentum
Wall Street’s technical backdrop has turned notably fragile, with major benchmark indices slipping below critical long-term support levels. The S&P 500, Nasdaq Composite and Dow Jones Industrial Average have all broken beneath their 200-day exponential moving averages, a widely followed indicator of trend direction.
Such a move carries significance beyond short-term volatility. It suggests that the strong upward momentum seen in previous months is fading, raising the possibility that equities are entering a more prolonged corrective phase.
Technical Analysis: Price Action Signals a Regime Shift
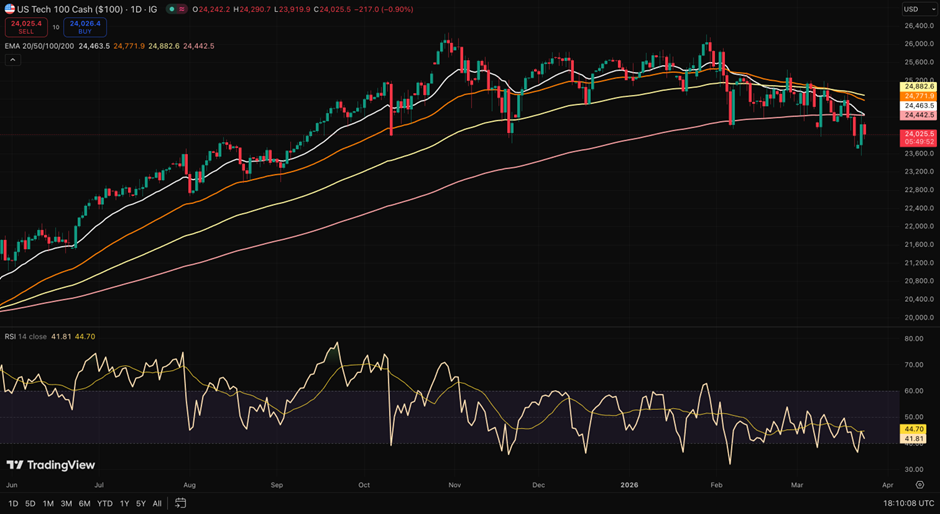
Nasdaq 100 Daily Price Chart. Source: tradingview.com, Analysis by Kalkine Group
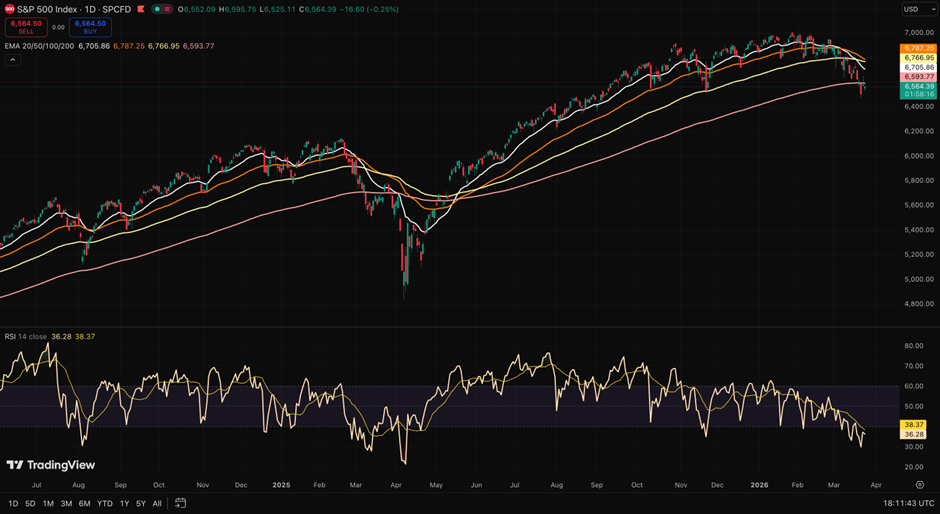
S&P 500 Daily Price Chart. Source: tradingview.com, Analysis by Kalkine Group
Price Action Analysis
The breach below the 200-day EMA marks a critical shift in trend structure. For much of the past year, this level acted as a dynamic support, reinforcing bullish sentiment during pullbacks. The recent breakdown suggests that buyers are no longer defending these levels with the same conviction.
The indices are now trading in a lower high, lower low formation on shorter time frames, indicating the early stages of a potential downtrend. Attempts to stabilise have been met with selling pressure, highlighting a lack of follow-through from buyers.
Key resistance now lies near the reclaimed 200-day EMA levels, while immediate support zones sit near recent swing lows. A sustained failure to reclaim the long-term average could accelerate downside momentum.
Momentum Indicators
Momentum indicators reinforce the bearish tilt. The Relative Strength Index is hovering near the 40 mark across major indices, a level that typically reflects weakening demand and growing control by sellers.
While not yet in oversold territory, the RSI’s trajectory suggests a gradual erosion of bullish strength rather than a sharp capitulation. This type of momentum profile is often associated with early-stage bearish trends rather than late-cycle sell-offs.
Moving Averages and Trend Structure
Short-term moving averages such as the 21-day and 50-day EMAs have started to roll over and are converging downward. The longer-term 200-day EMA, once a support base, is now acting as resistance.
This alignment indicates a deterioration in trend strength across multiple time horizons, reinforcing the view that the market is transitioning away from a bullish phase.
Macro Context: Pressure from Rates, Inflation and Geopolitics
The technical breakdown is occurring against a challenging macroeconomic backdrop. Inflation remains persistent, complicating the outlook for monetary policy. Central banks, particularly the Federal Reserve, continue to signal a higher-for-longer stance on interest rates.
At the same time, geopolitical tensions and trade uncertainties are re-emerging as risk factors. These dynamics are contributing to tighter financial conditions and a more cautious investment environment.
The combination of elevated rates and policy uncertainty is beginning to weigh on equity valuations, particularly in growth-sensitive sectors.
Market Implications: From Momentum to Risk Management
The move below key technical levels does not, in isolation, confirm the onset of a full bear market. However, it does signal a meaningful shift in market regime.
During the previous rally, equities were driven largely by momentum and liquidity. The current environment appears more fragile, with investors increasingly focused on capital preservation and risk management.
There are parallels with earlier periods of policy-driven volatility, including the tariff-related disruptions seen during the Trump administration. In those instances, technical breakdowns were followed by extended phases of market weakness.
Strategic Outlook: A Critical Test for Markets
The coming sessions will be pivotal in determining whether the current breakdown develops into a broader downturn. A recovery above the 200-day EMA could stabilise sentiment and restore confidence in the prevailing trend.
Conversely, continued weakness would reinforce the bearish narrative, particularly if supported by unfavourable macroeconomic data or further tightening in financial conditions.
Investors are likely to remain cautious until clearer signals emerge, both from price action and from the macro environment.
Conclusion: Markets Enter a Phase of Uncertainty
The breach of long-term technical support marks a turning point for Wall Street. While not yet definitive, the shift suggests that the balance of power is moving away from buyers.
In this environment, optimism is giving way to caution. Markets are no longer driven by momentum alone but are increasingly shaped by uncertainty around policy, inflation and global risk factors.
For investors, the message is clear. The focus is shifting from chasing returns to managing risk in a more complex and less predictable landscape.
FAQ Section
- Why is the 200-day EMA important for markets?
The 200-day EMA is a widely used indicator of long-term trend direction. When prices fall below it, it often signals weakening momentum and a potential shift from a bullish to a bearish trend. - What does an RSI near 40 indicate?
An RSI near 40 suggests weakening buying momentum and growing seller dominance. It is not yet oversold but often reflects early stages of a bearish trend rather than a market bottom. - Does this confirm a bear market?
Not necessarily. While the technical signals are negative, confirmation of a bear market typically requires sustained declines and broader economic deterioration. Current signals indicate increased risk, not certainty. - How do macro factors influence this trend?
Persistent inflation, higher interest rates and geopolitical risks are tightening financial conditions. These factors reduce liquidity and investor risk appetite, amplifying the impact of technical breakdowns. - What should investors watch next?
Key indicators include whether indices reclaim the 200-day EMA, upcoming inflation data, central bank signals and overall market breadth. These will help determine if the current weakness deepens or stabilises.


 Please wait processing your request...