
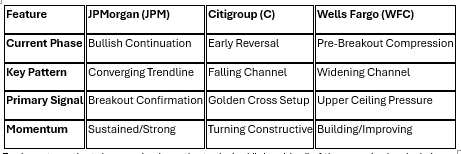
Combined Executive Summary: Key Technical Highlights
The banking sector is exhibiting a powerful synchronized shift in market structure. Across the "Big Three," technical indicators suggest a move away from uncertainty toward a confirmed or emerging bullish regime.
- Breakout Confirmation: JPMorgan (JPM) has successfully exited a long-term converging trendline, while Citigroup (C) has broken out of a multi-quarter falling channel. Wells Fargo (WFC) is currently pressuring the upper ceiling of a widening channel, signaling imminent volatility expansion.
- The "Golden Cross" Phenomenon: Both JPMorgan and Citigroup are entering the highly coveted "Golden Cross" setup (21-period SMA crossing above the 50-period SMA), a classic signal used by institutional traders to confirm long-term trend reversals and bullish continuations.
- Momentum Alignment: Across all three tickers, the Relative Strength Index (RSI) is holding in positive territory and the MACD is expanding, confirming that current price gains are backed by genuine buying pressure rather than low-volume "dead cat" bounces.
- Structural Shifts: There is a notable transition from distribution/compression to accumulation/expansion. Former resistance levels are now serving as psychological and technical support floors.
- Institutional Accumulation: The "drifting higher" price action—characterized by higher lows and reduced downside volatility—points toward steady institutional position-building ahead of the earnings cycle.
- JPMorgan Chase & Co. (JPM): Strong Bullish Continuation
JPMorgan continues to lead the pack, transitioning from a period of volatility compression into a clear expansionary phase. The stock has successfully navigated a complex converging trendline, suggesting that the previous equilibrium between buyers and sellers has been decisively resolved in favor of the bulls.
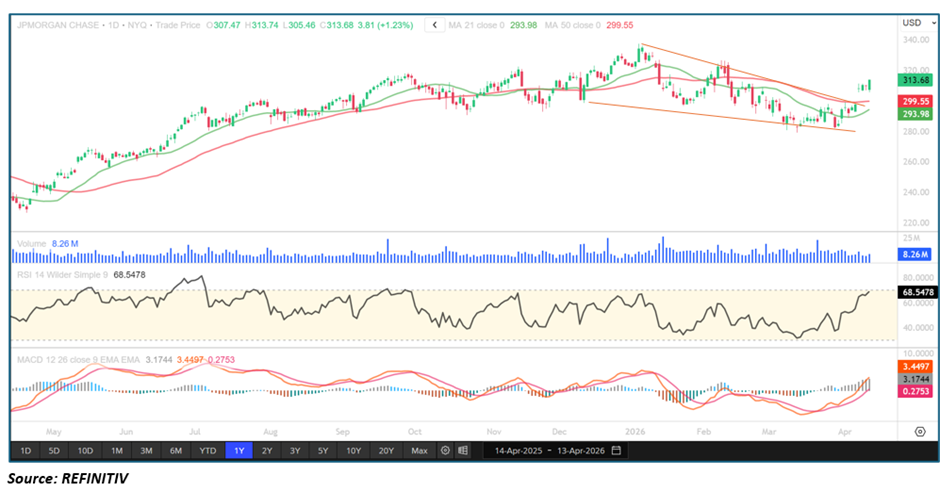
- Trend Structure: Beyond Compression
For several months, JPM was contained within a narrowing price range. This converging trendline structure acted as a pressure cooker, where tightening swings signaled a standoff. The recent breakout above the upper boundary is a "regime shift" signal. It indicates that the market has accepted higher valuations and is ready for a sustained directional move.
The hallmark of this breakout is acceptance. Rather than a "fake-out" where price spikes and immediately retreats, JPM is holding its gains above the breakout zone. This confirms that the prior resistance has officially flipped to support, providing a launchpad for the next leg of the uptrend.
- Moving Averages: The Golden Cross Catalyst
The most compelling medium-term signal for JPM is the approaching Golden Cross.
- The Setup: The 21-period Simple Moving Average (SMA) is aggressively trending upward toward the 50-period SMA.
- The Implication: When the shorter-term average crosses above the longer-term average, it signals a powerful shift in momentum.
- Price Proximity: JPM is already trading comfortably above both averages, creating a "bullish stack" that provides multiple layers of dynamic support.
- Momentum and Market Indicators
The RSI (14-period) remains in a "Goldilocks" zone—strong enough to show conviction, but not yet high enough to signal exhaustion. This suggests there is still significant "runway" before the stock becomes overbought. Simultaneously, the MACD histogram is expanding, confirming that buying pressure is accelerating rather than fading.
- Outlook and Key Levels
- Bullish Case: Price maintains its position above the breakout zone, the Golden Cross completes, and the stock drifts toward historical extension zones.
- Support: The breakout zone and the 21-period SMA.
- Resistance: Immediate swing highs and psychological milestones.
- Citigroup Inc. (C): The Reversal Narrative
While JPM represents continuation, Citigroup represents a structural turnaround. After a prolonged period of underperformance defined by a descending channel, the technical tide has turned, signaling an early-stage trend reversal.
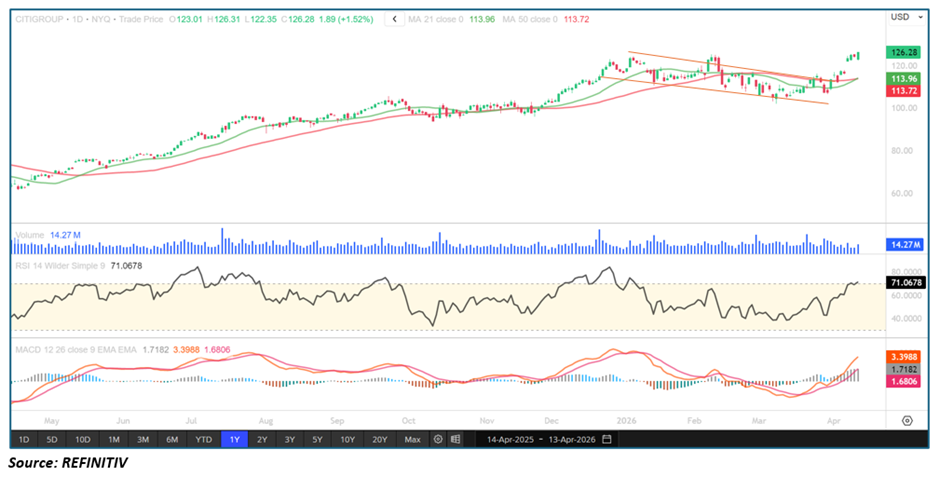
- Escaping the Descending Channel
For quarters, Citigroup was trapped in a falling channel, a structure defined by relentless lower highs and lower lows. This was a textbook "distribution" phase. However, the stock has recently pierced the upper boundary of this channel. This breakout is the first major evidence that the multi-month downtrend has been broken.
The follow-through buying post-breakout is particularly constructive. By forming a series of higher highs, Citigroup is moving out of a "bearish regime" and into an "accumulation phase," where investors are now looking to buy pullbacks rather than sell rallies.
- Momentum Shift: RSI and MACD
The transition in Citigroup is most visible in its momentum oscillators:
- RSI: Has crossed above the 50-neutral level, indicating that for the first time in a long period, bullish days are outweighing bearish ones.
- MACD: Has confirmed a bullish crossover and is moving into positive territory. This is a critical indicator of trend stabilization after prolonged weakness.
- The Developing Golden Cross
Similar to JPM, Citigroup is nearing a Golden Cross. For a stock that has been beaten down, this crossover serves as a "all-clear" signal for many trend-following algorithms. If the 21-period SMA completes its move above the 50-period SMA, it will provide the structural confirmation needed to attract more conservative institutional capital.
- Strategic Scenarios
- Primary Case: Citigroup continues its "controlled drift" higher, using the former channel resistance as a new floor.
- Risk: A "false breakout" where price sinks back into the channel, though current momentum suggests this is the less likely outcome.
III. Wells Fargo & Company (WFC): The Inflection Point
Wells Fargo is currently at the most sensitive technical juncture of the three. It is navigating a falling widening channel—a structure often associated with high volatility and investor uncertainty—but it is now showing signs of a major resolution.
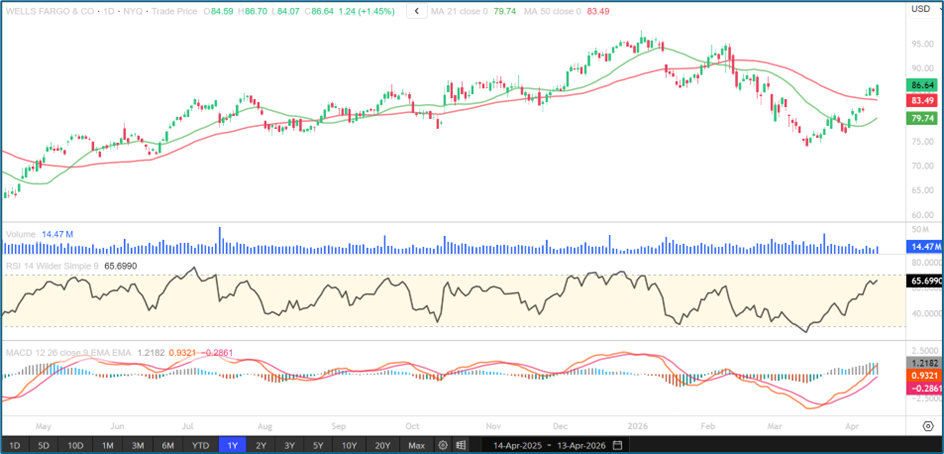
- Structural Resolution: From Floor to Ceiling
After finding significant support at the lower boundary of its widening channel, WFC has undergone a steady recovery. The stock is no longer bouncing aimlessly; it is purposefully drifting toward the upper resistance ceiling.
A widening channel typically reflects a lack of consensus. However, the recent compression near the upper edge suggests that "breakout pressure" is building. A decisive close above this ceiling would represent a move from a volatile consolidation phase into a fresh bullish cycle.
- Moving Averages as a Safety Net
Unlike the Simple Moving Averages used for JPM and Citi, Wells Fargo’s Exponential Moving Averages (EMAs) are providing a clearer picture of short-term support.
- The 21-period EMA is currently acting as a "sliding floor," catching minor pullbacks.
- The 50-period EMA serves as the medium-term structural anchor.
As long as WFC stays above these EMAs, the "path of least resistance" remains to the upside.
- Momentum: Buying Strength
The 14-period RSI has moved upward from the neutral zone, reflecting improved demand. Critically, there is no bearish divergence, meaning the price increases are well-supported by the underlying momentum. The MACD is also in a bullish crossover state, hinting that the "exhaustion" phase of the prior downtrend is over.
- Technical Scenarios
- Breakout Continuation: A surge above the channel resistance leads to a rapid volatility expansion to the upside.
- Retest: A breakout followed by a "kiss of death" retest of the channel ceiling (confirming it as support) before moving higher.
- Rejection: A failure at the ceiling would send the stock back into the middle of the range to find more liquidity.
Conclusion: A Sector-Wide Bullish Regime
The charts of JPMorgan, Citigroup, and Wells Fargo collectively suggest a sector that has moved past its "low point" and is now entering a period of renewed strength.
For investors, the takeaway is clear: the technical "plumbing" of these major banks is improving. While JPMorgan is the clear leader in terms of trend maturity, Citigroup and Wells Fargo offer the potential of early-stage reversals. As long as these breakout zones and moving average supports hold, the technical outlook remains firmly biased to the upside heading into the next earnings cycle.


 Please wait processing your request...