
Key Highlights
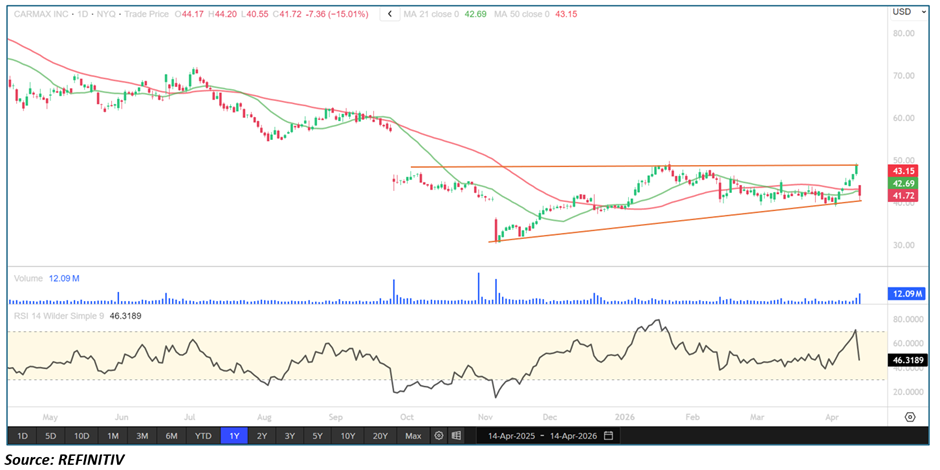
- CarMax Inc. is trading near the upper boundary of a converging trend structure, failing to sustain upside momentum
• Price is now rolling over toward the lower boundary, increasing the risk of a breakdown
• RSI has sharply dropped from overbought territory to below the midline (50) in a single session, signaling momentum deterioration
• Price has slipped below both the 21-period and 50-period SMAs, indicating weakening trend structure
• Market reaction remains negative following fundamental concerns, reinforcing bearish sentiment
• Overall setup reflects a potential transition from consolidation to downside breakdown phase
Trend Structure: Converging Pattern Near Breakdown Point
CarMax is currently trading within a converging trend formation (triangle-like structure), where price action has been compressing between rising support and falling resistance.
Such structures typically represent indecision before a breakout or breakdown. In this case, price recently tested the upper boundary but failed to break higher, indicating lack of bullish conviction.
Following this rejection, price has started to rotate lower toward the support trendline, bringing it dangerously close to a breakdown zone.
A decisive move below the lower boundary would confirm a bearish resolution of the pattern, often leading to an expansion in volatility on the downside.
Price Action: Rejection at Highs and Emerging Weakness
Recent price action shows clear signs of exhaustion:
• Failure to sustain above resistance trendline
• Lower highs forming after rejection
• Increasing selling pressure near the top of the range
• Gradual drift toward support with weak bounce attempts
This type of behavior typically reflects distribution, where selling interest begins to outweigh buying demand.
The inability to hold near highs suggests that buyers are losing control, increasing the probability of a breakdown move.
Moving Averages: Breakdown Below 21 & 50 SMA
A key technical deterioration is visible in the moving average structure:
- Price has fallen below the 21-period SMA, indicating short-term weakness
• Price has also broken below the 50-period SMA, confirming medium-term pressure
• Both moving averages are beginning to flatten or turn downward
When price trades below both short- and medium-term averages, it often signals a shift from bullish/neutral structure to bearish bias.
These levels may now act as dynamic resistance zones on any attempted bounce.
Momentum Indicators: RSI Signals Sharp Weakening
The RSI behavior is particularly notable:
- Recently in overbought territory, reflecting prior bullish momentum
• Dropped below the 50 midline in a single session
• Indicates a sharp momentum reversal
Such a swift transition typically signals:
• Exhaustion of buying pressure
• Emergence of aggressive sellers
• Increased probability of continued downside
This momentum shift aligns with the weakening price structure and supports a bearish outlook.
Fundamental Backdrop: Weak Sentiment Adds Pressure
Recent developments surrounding CarMax Inc. have added to the negative sentiment:
- Shares declined sharply after the company announced price cuts to boost demand, raising concerns about margins
• The company is shifting toward older, higher-mileage vehicles, reflecting affordability pressures among consumers
• Management highlighted that non-prime borrowers are struggling with loan affordability, pointing to demand-side weakness
• The decision to pause share buybacks to conserve cash has raised concerns about growth costs
• Despite meeting expectations, investors remain skeptical about the turnaround strategy and cost structure
Broader macro factors also weigh on sentiment:
• High interest rates impacting auto financing
• Inflation pressures reducing consumer purchasing power
• Weak consumer sentiment affecting discretionary spending
This fundamental backdrop reinforces the technical weakness, increasing the likelihood of downside continuation.
Market Structure: Transition Toward Bearish Breakdown Phase
The combined technical and fundamental setup suggests a shift in structure:
- Rejection from upper boundary of converging pattern
• Momentum breakdown (RSI below midline)
• Moving average breakdown (below 21 & 50 SMA)
• Negative sentiment reinforcing selling pressure
This alignment typically signals a transition from consolidation to bearish expansion phase.
Key Technical Levels & Scenarios
Support Levels
- Lower boundary of converging structure (critical breakdown level)
• Recent swing lows near support zone
Resistance Levels
- 21-period SMA (near-term resistance)
• 50-period SMA (stronger resistance)
• Upper boundary of converging trend
Scenarios
- Bearish Breakdown (Primary Case)
• Price breaks below lower trendline support
• RSI remains below 50
• Moving averages act as resistance
• Downside acceleration toward lower support zones - Temporary Bounce
• Price rebounds from support
• Faces rejection near 21/50 SMA
• Weak rally within broader downtrend - Bullish Invalidity (Low Probability)
• Price reclaims both SMAs
• Breaks above upper trendline
• Momentum indicators recover
Conclusion: Structure and Sentiment Point Toward Downside Risk
CarMax is showing clear signs of technical and fundamental weakness. The rejection at the upper boundary of a converging structure, combined with a sharp RSI drop and breakdown below key moving averages, signals increasing downside pressure.
At the same time, concerns around affordability, pricing strategy, and growth outlook are weighing on investor sentiment, reinforcing the bearish case.
Unless the stock quickly reclaims key resistance levels, KMX appears to be on the verge of a breakdown, with the potential for a volatility expansion to the downside.


 Please wait processing your request...