_04_15_2026_23_46_22_166891.jpg)
Key Highlights
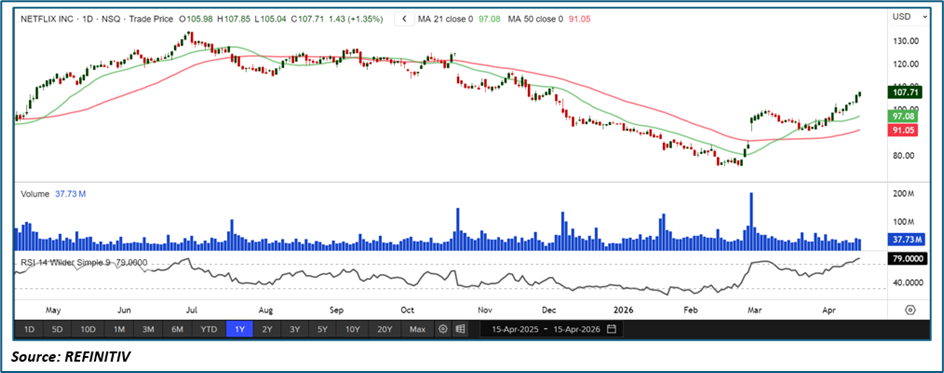
- Netflix has staged a strong recovery rally, pushing toward recent highs with consistent bullish candles
• Price is trading firmly above both the 21-period SMA (~97) and 50-period SMA (~91), confirming trend strength
• RSI is elevated near ~79, signaling overbought conditions but also strong momentum
• Moving averages are positively aligned, with the 21 SMA leading above the 50 SMA
• Volume spikes during the rally indicate participation and accumulation
• Structure suggests continuation potential, though short-term cooling is possible
Trend Structure: Reversal from Downtrend into Bullish Recovery
Netflix has transitioned from a clear downtrend into a recovery phase. The chart shows:
• A prolonged decline into early 2026
• A base formation around the lows (~$75–80 zone)
• A sharp reversal followed by higher lows and higher highs
This shift marks a trend reversal turning into early-stage uptrend. The structure now resembles accumulation followed by expansion—often the beginning of a sustained move higher.
Price Action: Strong Recovery with Controlled Pullbacks
Recent price action reflects growing bullish control:
• Clean breakout from the bottoming range
• Series of higher lows confirming demand
• Strong closes near highs, indicating buyers in control
• Minimal rejection at resistance levels
This type of steady climb—rather than parabolic spikes—typically supports continuation rather than immediate reversal.
Moving Averages: Bullish Alignment Confirmed
The moving average structure is now clearly supportive:
• Price is above the 21-period SMA (short-term strength)
• Price is well above the 50-period SMA (trend confirmation)
• Both averages are sloping upward
• 21 SMA is leading above the 50 SMA (bullish alignment)
This confirms a trend shift from bearish to bullish, with moving averages now acting as dynamic support zones.
Momentum Indicators: RSI Overbought but Strong
The RSI is currently near 79, which is firmly in overbought territory.
However:
• RSI above 70 often signals strong momentum, not immediate reversal
• In trending markets, RSI can stay elevated for extended periods
• Current readings align with strong upside pressure
Data shows NFLX RSI levels above ~70 are common during rallies and can still produce gains, though they increase pullback risk
From a sentiment perspective, NFLX is also being flagged among overbought stocks (RSI >70) in recent market scans
Volume Analysis: Accumulation During the Move
Volume behavior supports the bullish case:
• Increased volume on upward moves
• Lower relative volume on pullbacks
• Indicates accumulation rather than distribution
This type of volume profile strengthens the probability of continuation.
Market Structure: Recovery → Expansion Phase
The broader setup reflects a classic bullish transition:
• Downtrend → Base → Breakout → Expansion
• Strong RSI momentum
• Price above key moving averages
• Higher highs and higher lows
This alignment suggests the stock is in the early-to-mid phase of a new uptrend, not a topping phase.
Key Technical Levels & Scenarios
Support Levels
• 21-period SMA (~97) – first pullback zone
• 50-period SMA (~91) – stronger structural support
• Prior breakout zone (~100 area)
Resistance Levels
• Recent highs near $108–110
• Potential extension toward $115+
cenarios
- Bullish Continuation (Primary Case)
• Price holds above $100 breakout zone
• RSI remains elevated (60–75 range after reset)
• Trend continues toward $110–115+ - Healthy Pullback (Secondary Case)
• RSI cools from overbought levels
• Price retraces toward 21 SMA
• Higher low forms → continuation resumes - Bearish Reversal (Low Probability)
• Price loses $100 support
• RSI drops below 50
• Breakdown below 50 SMA
• Would invalidate recovery structure
Conclusion: Strong Momentum, But Watch for Cooling
Netflix is showing a powerful bullish recovery with strong momentum and trend alignment. The overbought RSI reflects strength, not immediate weakness but it does increase the probability of short-term consolidation.
As long as price holds above key support (especially the 21 and 50 SMAs), the setup favors continued upside, with pullbacks likely serving as buying opportunities rather than signals of trend failure.


 Please wait processing your request...