
Key Highlights
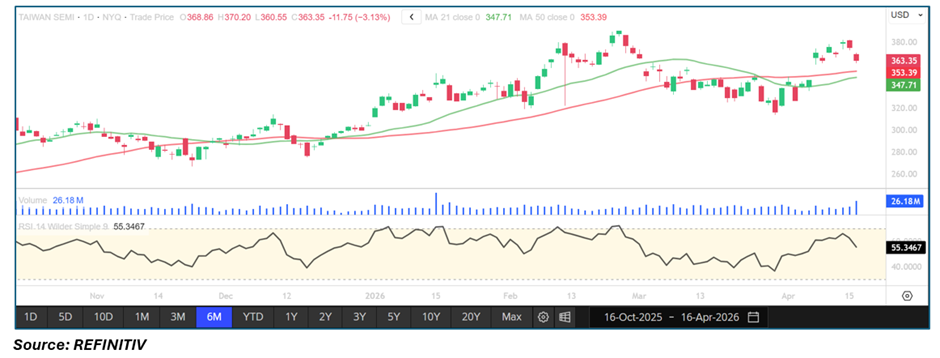
- Taiwan Semiconductor Manufacturing Company has reclaimed both the 21-period and 50-period SMAs, signaling a strengthening trend structure
• Price action is forming higher highs, confirming improving bullish market structure
• RSI is trending positively, reflecting sustained upward momentum
• Broader time frame trend remains strongly bullish, aligning with shorter-term strength
• The setup suggests continuation of an established uptrend rather than early exhaustion
Trend Structure: Strong Uptrend Across Time Frames
TSM is not just showing short-term strength—it is aligned with a broader bullish trend.
Key structural characteristics include:
• Price holding above key moving averages
• Consistent formation of higher highs and higher lows
• Alignment between lower and higher time frame trends
This indicates institutional support and a well-established bullish structure rather than a fragile reversal.
Price Action: Sustained Strength with Higher Highs
Recent price behavior reinforces bullish continuation:
- Break above prior swing highs
• Strong bullish candles with follow-through
• Shallow pullbacks, indicating aggressive buying
The presence of higher highs suggests:
• Continuation of bullish market structure
• Strong demand at elevated levels
• Increased probability of trend persistence
Moving Averages: Reclaim of 21 & 50 SMA Confirms Strength
The moving average setup supports a bullish outlook:
- Price is trading above the 21-period SMA (short-term momentum)
• Price is also above the 50-period SMA (medium-term confirmation)
• Both averages are likely sloping upward
When both SMAs are reclaimed and sustained:
• They act as dynamic support zones
• Pullbacks tend to be bought quickly
• Trend continuation becomes more probable
Momentum Indicators: RSI Positive and Supportive
RSI behavior confirms bullish momentum:
- RSI is trending upward steadily
• Holding above the 50 level (bullish zone)
• No visible bearish divergence
In strong uptrends:
• RSI staying elevated reflects strength, not weakness
• Momentum tends to persist rather than fade quickly
This indicates sustained buying pressure.
Volume Analysis: Participation Likely Supporting Trend
Although not explicitly quantified, a strong trend typically aligns with:
- Increased participation during upward moves
• Healthy volume expansion on breakouts
• Continued interest from institutional players
This reinforces the credibility of the ongoing trend.
Market Structure: Bullish Continuation Within Larger Trend
The overall structure shows alignment across signals:
- Price above key SMAs
• Higher highs formation
• Positive RSI momentum
• Strong higher time frame trend
This combination typically reflects a continuation phase rather than a reversal setup.
Key Technical Levels & Scenarios
Support Levels
- 21-period SMA (immediate dynamic support)
• 50-period SMA (stronger support base)
• Recent breakout zone
Resistance Levels
- Recent swing highs
• Psychological price levels ahead
Scenarios
- Bullish Continuation (Primary Case)
• Price holds above 21 & 50 SMA
• RSI remains above 50–60 zone
• Continued higher highs and higher lows
• Expansion toward new highs - Healthy Pullback (Secondary Case)
• Price retraces toward 21 SMA
• Buyers defend the level
• Higher low forms
• Trend resumes upward - Bearish Breakdown (Low Probability)
• Price falls below 50 SMA
• RSI weakens below 50
• Structure shifts to neutral or bearish
Conclusion: Multi-Timeframe Strength Supports Further Upside
Taiwan Semiconductor Manufacturing Company is exhibiting strong bullish characteristics, with price reclaiming key moving averages, maintaining positive RSI momentum, and aligning with a broader uptrend.
The combination of short-term strength and higher time frame confirmation suggests a continuation phase, where dips are more likely to be bought rather than signal reversals.
As long as TSM sustains above the 21 and 50 SMAs, the prevailing bias remains bullish, favoring continued upside momentum.


 Please wait processing your request...