_04_15_2026_23_45_35_924895.jpg)
Key Highlights
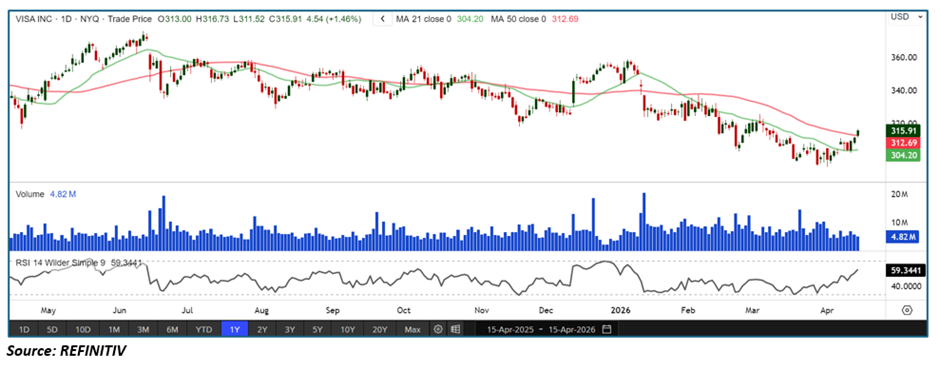
- Visa is showing a rebound from recent lows, with price reclaiming key moving averages
• Price has moved above the 21-period SMA (~304) and is testing the 50-period SMA (~312)
• RSI is near ~59, indicating strengthening momentum without being overbought
• 21 SMA is turning upward and approaching the 50 SMA (potential bullish crossover setup)
• Volume remains stable with slight expansion on bullish days
• Structure suggests early-stage recovery rather than full trend confirmation
Trend Structure: Transition from Downtrend to Recovery Phase
Visa has been in a broader downtrend, but recent price action signals a potential trend shift:
• Extended decline into March lows (~$300 zone)
• Formation of a base with higher lows
• Recent breakout from short-term consolidation
This structure reflects a bottoming process transitioning into recovery, rather than a fully established uptrend. The key question now is whether this evolves into sustained bullish continuation.
Price Action: Gradual Strength with Higher Lows
Recent price behavior shows improving demand:
• Higher lows forming consistently
• Strong bullish candles pushing into resistance
• Reduced downside volatility compared to prior decline
• Price reclaiming key technical levels
This type of controlled recovery often precedes stronger trend reversals—provided resistance levels are cleared.
Moving Averages: Reclaim + Potential Crossover Setup
The moving average structure is improving:
• Price has reclaimed the 21-period SMA (short-term strength)
• Price is now testing the 50-period SMA (key trend level)
• 21 SMA is turning upward and closing the gap with the 50 SMA
A confirmed bullish crossover (21 above 50) would:
• Signal a shift from bearish to bullish trend alignment
• Attract momentum traders
• Reinforce continuation potential
Historically, Visa had been trading below key moving averages earlier in 2026, indicating weakness —so reclaiming them is a meaningful change in structure.
Momentum Indicators: RSI Shows Room to Run
The RSI is currently around 59, which is:
• Neutral-to-bullish (not overbought)
• Indicates growing momentum
• Leaves room for further upside before exhaustion
Recent data shows Visa’s RSI typically fluctuates in neutral ranges during transitions before trending higher
This is a key difference vs overextended stocks—Visa still has capacity to move higher without immediate pullback pressure.
Volume Analysis: Stabilization with Early Accumulation Signs
Volume trends suggest:
• No aggressive selling pressure
• Slight expansion on upward moves
• Stabilization after prior distribution phase
While not explosive, this is typical of early-stage recoveries, where accumulation quietly builds before breakout.
Market Structure: Recovery Attempt, Not Full Breakout Yet
The broader technical structure:
• Downtrend → Base → Early recovery
• Price reclaiming moving averages
• Momentum improving (RSI rising)
This is not yet a confirmed breakout, but a transition phase that could evolve into one.
Key Technical Levels & Scenarios
Support Levels
• 21-period SMA (~304) – immediate support
• Psychological $300 level – key structural support
• Recent higher low zone
Resistance Levels
• 50-period SMA (~312–313) – critical near-term resistance
• $320 zone – prior breakdown area
• $330+ – major resistance cluster
Scenarios
- Bullish Reversal (Primary Case Developing)
• Price breaks and holds above 50 SMA
• 21 SMA crosses above 50 SMA (golden crossover)
• RSI pushes into 60–70 range
• Upside continuation toward $320–330 - Consolidation (Most Likely Short-Term)
• Price stalls near 50 SMA
• RSI remains between 50–60
• Sideways range builds before next move - Bearish Continuation (Invalidation)
• Rejection at 50 SMA
• Price falls back below 21 SMA
• RSI drops below 50
• Signals failed recovery
Conclusion: Early Bullish Shift with Room to Grow
Visa is showing early signs of a trend reversal, supported by improving price structure and rising momentum. Unlike overbought setups, RSI remains in a healthy zone, giving the stock room to extend higher.
The key trigger now is a clean break above the 50 SMA and potential crossover confirmation. If that happens, the setup shifts from recovery to trend continuation, with higher levels likely ahead.


 Please wait processing your request...