
 CA
 NZ
 UK
 AU
 IND

 US

 Share
 X (Formerly Twitter)
 Whatsapp
 Facebook
 LinkedIn
 Telegram
 Email This Article
 Copy Link
 Summarize with AI
 Chat GPT
 Perplexity

Key Highlights
• MAA's new leases were signed 5.3% below the previous rent while renewals rose 5.2%; Camden's new leases fell 3.3% while renewals rose 2.8%.
• Camden sold its 11 California communities for about $1.625 billion, becoming an almost pure Sunbelt Supply story, while MAA kept lower Leverage at 4.5 times adjusted EBITDA versus Camden's 5.3 times.
• Both managements said apartment absorption is now outpacing new deliveries, with MAA citing 13 straight quarters of below-average construction starts across its markets.
For Mid-America Apartment Communities (NYSE:MAA) and Camden Property Trust (NYSE:CPT), the pace of new apartment supply sets the price of the next lease, a critical Factor for both S&P 500 real estate Investment trusts with large Sunbelt portfolios. A wave of new buildings has forced landlords to compete for tenants. Their results for the three months to June 30, 2026, show that pressure easing but not over: rents on new leases were still falling at both, while renewals rose. How fast deliveries shrink from here will shape each company's revenue, Earnings and use of capital.
Two Sunbelt Landlords, One Pressure Point
MAA, based in Memphis, owned 104,698 apartment units across 16 states and the District of Columbia at June 30, 2026. Camden, based in Houston, reported 56,695 operating homes in 167 communities, plus three developments under construction. Both sit in the Real Estate sector under the Multi-Family Residential REITs sub-industry.
Both shares are listed on the New York Stock Exchange, and both are S&P 500 constituents. MAA joined the index in December 2016 and Camden in April 2022; neither was affected by the September 2026 quarterly rebalance.
How Supply Reaches the Income Statement
A newly completed building needs to Fill quickly, so developers often offer concessions such as several weeks of free rent. Nearby landlords must match those deals to win incoming tenants, which drags down new-lease rates: the change in rent when one resident replaces another. Existing residents face moving costs, so renewal increases usually hold up better. Landlords can therefore keep occupancy high while rents soften, which is broadly what both companies reported.
Because leases roll over through the year, weak new-lease pricing feeds into same-store Revenue with a lag. Same-store figures compare only properties owned throughout both periods, stripping out acquisitions and sales. When revenue is flat while payroll, insurance and property taxes keep rising, net Operating Income falls.
What the June Quarter Showed
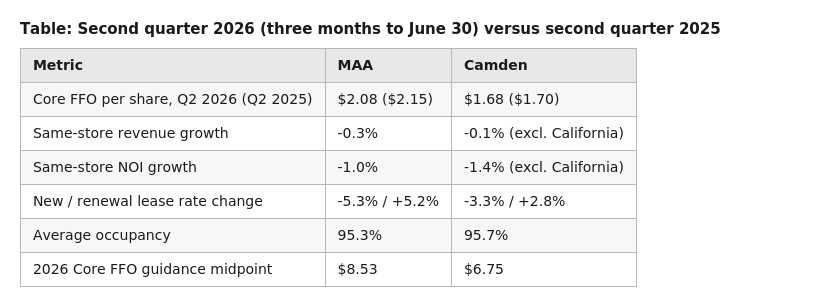
In results published on July 29, 2026, MAA reported that new leases were signed 5.3% below the previous rent, while renewals rose 5.2%, for a blended increase of 0.7%. Same-store revenue slipped 0.3% year on year, expenses rose 0.8% and NOI fell 1.0%. Core funds from operations was $2.08 a share, against $2.15 a year earlier.
Camden's release, published on July 30 and presented excluding California, followed the same pattern with smaller swings: new leases down 3.3%, renewals up 2.8% and a blended decline of 0.2%. Same-property revenue fell 0.1%, but expenses climbed 2.4%, so NOI dropped 1.4%. Core FFO was $1.68 a share, against $1.70.
Signs the Delivery Wave Is Passing
Both managements argue that absorption, meaning the number of homes newly occupied, is now outrunning new supply. On MAA's earnings call, chief operating officer Tim Argo said second-quarter absorption across its markets was 1.8 times new deliveries, and chief executive Brad Hill said new construction starts had run below long-term averages for 13 quarters. MAA held its 2026 Core FFO guidance midpoint at $8.53 a share.
Camden executives, led by chief executive Alex Jessett, told analysts that new supply is past peak levels in most of its markets, adding that occupancy reached 95.8% in July and that August and September renewal offers averaged 4.2% increases. Camden kept its $6.75 Core FFO midpoint, cut its same-property revenue midpoint to 0.50% from 0.75% and improved its NOI midpoint to -0.60% from -0.90%.
Different Answers on Capital Allocation
The two companies are responding differently. On July 29, 2026, Camden completed the sale of its 11 California communities, with 3,620 homes, for about $1.625 billion, and used roughly $900 million to repay its Credit line and commercial paper. It bought seven Sunbelt communities with 2,061 homes for $645.4 million and repurchased $422.9 million of its own shares in the first half.
That makes Camden (NYSE:CPT) an almost pure Sunbelt supply story. Management said the swap should be neutral for FFO in its first year and accretive later if newer Sunbelt properties grow faster than the older California Assets sold. The trade-off is greater exposure to markets where deliveries have been heaviest.
MAA (NYSE:MAA) has taken a steadier route: $50 million of Buybacks in the quarter, six communities with 1,749 units under construction, and land bought in Nashville and Northern Virginia for future building. Its net Debt was 4.5 times adjusted EBITDA at June 30, against 5.3 times at Camden, a figure that predates the California proceeds.
Risks to the Supply Argument
Supply relief helps only if Demand holds. A slower Sunbelt jobs market or weaker in-migration could reduce absorption just as deliveries fall. MAA's operating team still named Charlotte, Phoenix, Raleigh, Savannah and Nashville as facing heavy supply pressure, and those cities overlap with Camden's markets.
Costs are a second risk: Camden's 2.4% rise in same-property expenses outpaced revenue. Reported earnings also diverge from Core FFO. Camden's Net Income fell to $0.18 a share from $0.74, while MAA's rose to $1.04 from $0.92, a figure that included a $35 million gain on selling a Raleigh community.
Supply-Recovery Signals Ahead
Watch whether new-lease rent declines of 5.3% at MAA and 3.3% at Camden narrow in the next quarterly results, and whether renewal gains hold. Lease-up progress at MAA's five communities that were 74.4% physically occupied at June 30 matters too, along with Camden's reinvestment of its California proceeds, same-store expense growth, and any change to either company's 2026 guidance when it next reports.


 Nov 03, 2026





 Please wait processing your request...