
 CA
 NZ
 UK
 AU
 IND

 US

 Share
 X (Formerly Twitter)
 Whatsapp
 Facebook
 LinkedIn
 Telegram
 Email This Article
 Copy Link
 Summarize with AI
 Chat GPT
 Perplexity

Key Highlights
- AMZN trading at $255.06, up +$7.57 (+3.06%) on the session, with an intraday range of $249.75–$256.48 on volume of 27.27M shares — a decisive move that pushed price back above the descending trendline that had capped the last two months of trading.
- Price closed above both the 20-day EMA ($245.16) and the 50-day EMA ($246.02) for the first time since the May peak, with today's candle clearing the upper boundary of the recent $225–$260 consolidation box in a single session.
- RSI-14 has climbed to 60.22, crossing decisively above its signal line (48.70) — one of the more convincing bullish crosses on the chart since the February low, and a clean break out of the 40–55 range that had contained momentum through the summer pullback.
- The move follows a major prior advance from roughly $197 in February to a cycle high near $280 in early May (a gain of over 40%), meaning today's breakout attempt is occurring within a still-elevated multi-month uptrend rather than from depressed levels.
- Volume on today's rally, while not the largest print on the chart, is meaningfully above the recent baseline, adding some credibility to the reversal after weeks of subdued, range-bound trading.
- Both EMAs had flattened and begun curling higher into today's session, suggesting the moving-average structure was already stabilizing before price confirmed with today's breakout candle.
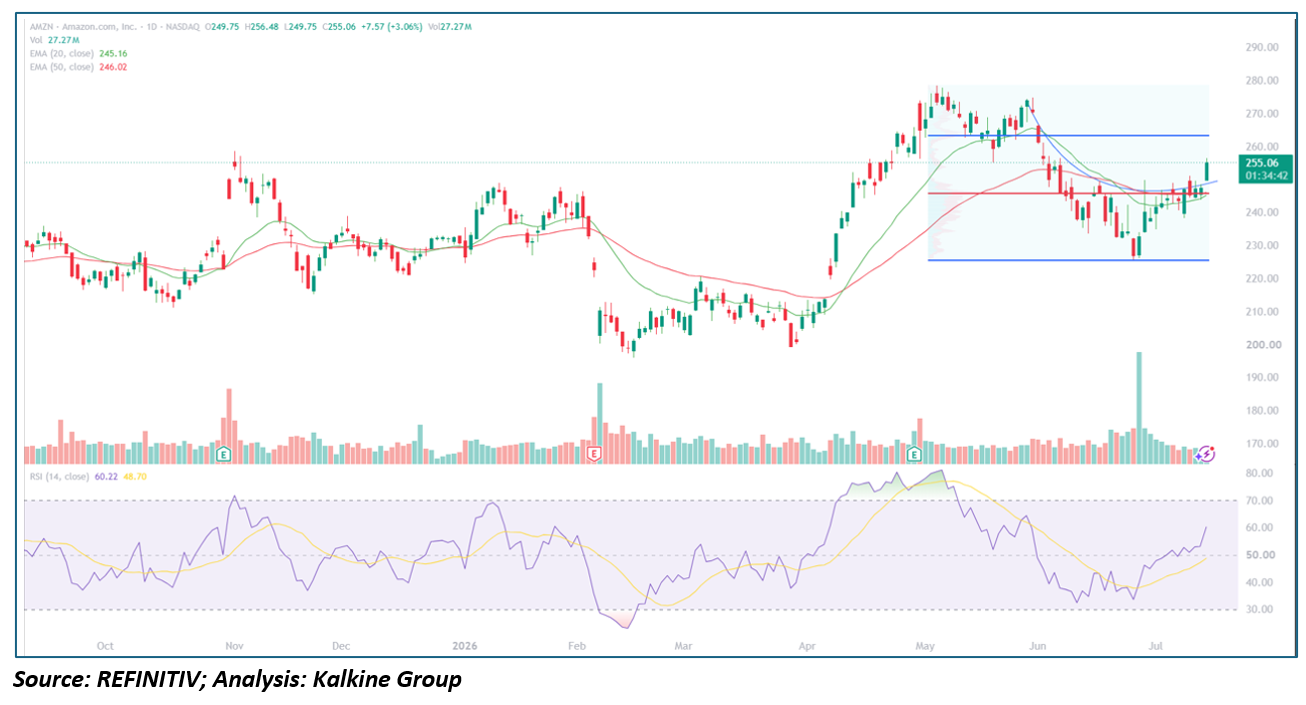
Trend Structure: Sideways Base, Earnings-Driven Selloff, Parabolic Recovery, and a Summer Pullback Now Testing Its Ceiling
Phase 1 — Choppy Range-Bound Trading (Oct – Dec 2025) AMZN spent the opening months of the period grinding sideways in a roughly $210–$245 band, with no clear directional bias. An earnings reaction in November produced a volume spike but little lasting follow-through, and both EMAs stayed relatively flat, reflecting an indecisive market.
Phase 2 — Late-Cycle Consolidation Into Year-End (Dec 2025 – Jan 2026) Price continued to churn within the same broad range, with the EMAs converging and RSI oscillating around the 50 midline — a classic basing pattern that gave little indication of the sharp move to come.
Phase 3 — Earnings-Driven Breakdown to the Cycle Low (Late Jan – Feb 2026) A sharp selloff around the February earnings date (marked on the volume pane) drove price down to a cycle low near $197, accompanied by one of the largest volume prints on the chart and an RSI plunge into oversold territory below 30. This capitulation marked the ultimate low of the period.
Phase 4 — Powerful Recovery Into a Parabolic Peak (Feb – May 2026) From the February low, AMZN staged a sustained and accelerating advance, climbing from roughly $197 to a cycle high near $280 in early May. RSI pushed into firmly overbought territory above 70 during this stretch, and both EMAs turned sharply higher, with price consistently holding above the green (20-day) EMA on pullbacks — a textbook uptrend structure. A large volume spike around the May earnings date coincided with the final push to the highs.
Phase 5 — Post-Peak Distribution and Descending Channel (May – Jul 2026) From the May peak, price rolled over into a multi-week decline, sliding from $280 down toward the $225 area by early-to-mid July — a pullback of roughly 20% from the highs. This decline traced out a descending channel (visible in the blue trendlines), with both EMAs rolling over and capping rallies throughout, and RSI cooling from overbought readings back into the 35–55 range, confirming the shift from uptrend to corrective phase.
Phase 6 — Range Compression and Breakout Attempt (Early–Mid Jul 2026) Over the past few weeks, price compressed into a tighter $225–$260 box as selling pressure eased, with RSI stabilizing in the mid-40s to low-50s. Today's session represents the first genuine test of the upper boundary of that box and the overhead descending trendline simultaneously — and price cleared both, closing near the highs of the session at $255.06.
Moving Averages: EMAs Flattening and Now Reclaimed From Above
Both the 20-day (green) and 50-day (red) EMAs had been drifting lower through June before flattening out in early-to-mid July as selling pressure diminished. Today's close above both averages — with the shorter EMA sitting just under the longer EMA, a sign the moving-average structure is not yet fully bullish-aligned — is the first close-based reclaim since the May top. A sustained hold above the $245–$246 EMA cluster on any pullback would be the more important confirmation than today's single-session breakout.
Momentum Analysis: RSI Crosses Its Signal Line and Reclaims the 60 Level
RSI-14's move to 60.22, above both the neutral 50 line and its own signal line at 48.70, marks a decisive momentum shift after weeks spent oscillating without direction during the May–July pullback. This is the strongest RSI reading since the overbought conditions of the February–May advance, though it remains well short of that period's extremes above 70, leaving room for further upside before momentum becomes stretched. A pullback that holds RSI above the 50 line would meaningfully strengthen the bullish case; a fade back below signal would suggest today's move was a single-session outlier.
Key Technical Levels
Resistance Levels
- $260.00 — top of the recent multi-week consolidation box and first overhead supply zone
- $270.00 — intermediate resistance from the May post-peak consolidation
- $280.00 — cycle high and ultimate bull target on a full trend resumption
Support Levels
- $245.00–$246.00 — 20-day/50-day EMA confluence and today's breakout level; the line in the sand for the move
- $240.00 — mid-range support within the recent consolidation box
- $225.00 — bottom of the July consolidation box and the descending channel's lower boundary
- $197.00 — origin of the February–May advance; deep bear scenario if revisited
Scenario Analysis
- Bullish Continuation (Constructive Case) — If AMZN holds above the $245–$246 EMA cluster and RSI continues to hold above 50, price could grind toward the $260 resistance zone and, on a decisive break, toward $270. A close that holds above today's breakout level on any retest would meaningfully improve the odds that the May–July pullback has run its course.
- Range-Bound Digestion (Base Case) — A more measured near-term outcome would see price consolidate between roughly $245 and $260 as the market digests today's sharp move, with RSI settling into the 50–65 range and the EMAs continuing to flatten or gently rise rather than accelerate.
- Failed Breakout (Bearish Case) — A reversal back below the $245–$246 EMA zone, especially if paired with RSI rolling back beneath its signal line, would suggest today's rally was a single-session technical bounce within an unresolved consolidation, reopening the path toward $240 and, ultimately, the $225 box support.
Conclusion
Amazon's sharp reversal back above its 20- and 50-day EMAs, combined with an RSI cross above its signal line and a break of the overhead descending trendline, marks the most constructive technical development since the stock peaked near $280 in early May. However, with the EMAs only just turning and the move still unconfirmed by a second session, today's action is best viewed as an important first step rather than definitive confirmation that the summer pullback is over. Follow-through above $260 with RSI holding above 50 on any retest of the breakout level would be the key signals needed to validate a resumption of the broader uptrend, while a quick failure back below the $245–$246 EMA zone would reopen the path toward deeper support near $225.
This analysis is based solely on the price chart provided and is intended for educational/informational purposes. It is not financial advice — technical patterns can fail, and any investment decision should incorporate fundamental research, risk tolerance, and, where appropriate, consultation with a licensed financial advisor.


 Nov 09, 2026





 Please wait processing your request...