
 CA
 NZ
 UK
 AU
 IND

 US

 Share
 X (Formerly Twitter)
 Whatsapp
 Facebook
 LinkedIn
 Telegram
 Email This Article
 Copy Link
 Summarize with AI
 Chat GPT
 Perplexity

Key Highlights
- AAPL trading at $327.32, up +$12.46 (+3.96%) on the session, with an intraday range of $317.32–$328.53 on volume of 35.9M shares — a breakaway session that cleared every Fibonacci retracement level drawn on the chart in a single move.
- Price is now trading well above both the 20-day EMA ($306.77) and the 50-day EMA ($297.59), extending the gap between price and trend that opened up over the past two weeks of recovery.
- RSI-14 has surged to 68.70, crossing decisively above its signal line (55.58) and back into the overbought zone above 70 that last appeared near the early-June cycle peak — a strong momentum signature, though one that also raises the question of near-term stretch.
- Today's close puts price above the entire 0.382–0.786 retracement grid (roughly $290–$308) drawn off the April–June advance, with the 1.618 Fibonacci extension near $343.63 now the most obvious upside reference point on the chart.
- The rally comes after a sharp June pullback that had dragged price from a cycle high near $320 down to roughly $280 — meaning today's breakout effectively completes a full round-trip back to, and now through, the prior highs.
- Volume on today's move, while elevated, is not the largest print on the chart (that belongs to a sharp single-day spike in late June), suggesting the move is powerful but not yet at climactic extremes.
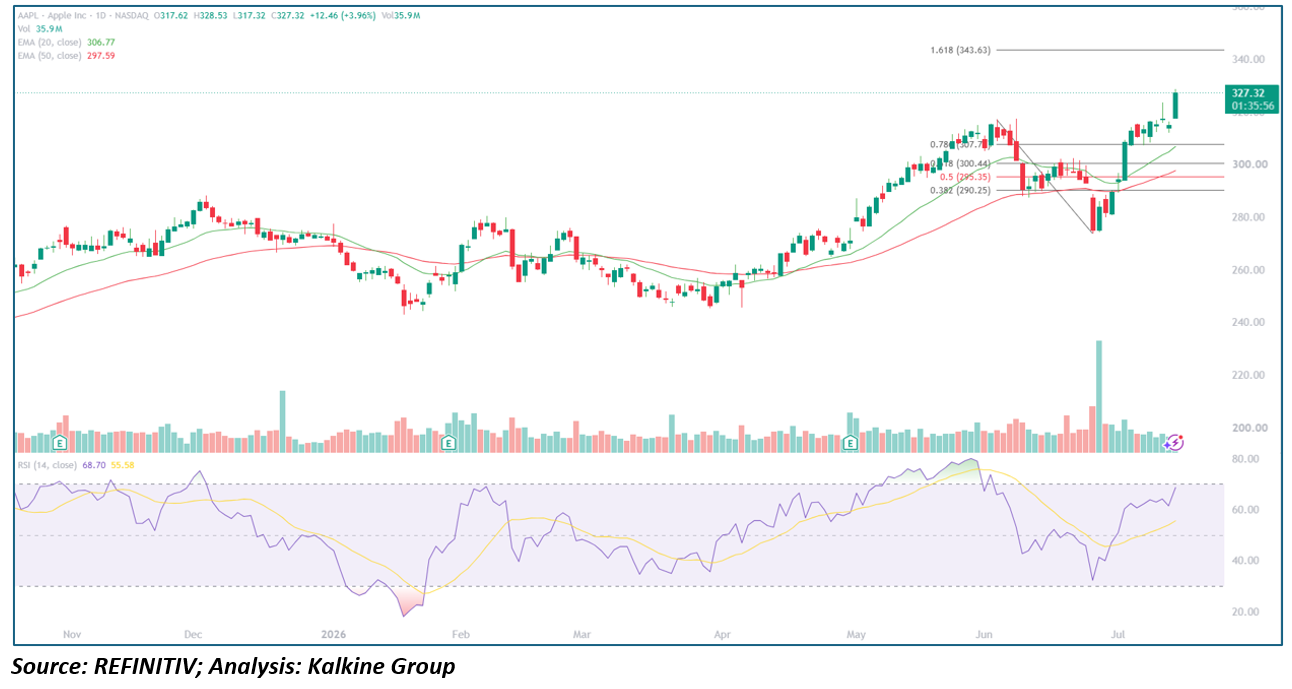
Trend Structure: Steady Fall Grind, Sharp Correction, Parabolic Recovery, and a Breakout Above the Fibonacci Grid
Phase 1 — Grinding Advance Into a First Peak (Oct – Dec 2025) AAPL spent the early part of the period climbing steadily from the mid-$240s toward the high-$280s, with the green (20-day) EMA providing consistent support on pullbacks. A volume spike around the November earnings date coincided with a local high before price began to lose momentum into December.
Phase 2 — Sharp Correction and Oversold Extreme (Dec 2025 – Jan 2026) Price rolled over into a steady decline from the high-$280s back down to the mid-$240s, with RSI plunging to an extreme oversold reading near 20 in late January — the most stretched momentum reading on the entire chart. This capitulation-style low set up the subsequent recovery attempt.
Phase 3 — Choppy Base-Building Range (Feb – Apr 2026) From the January low, AAPL entered an extended, directionless range roughly between $245 and $270, marked by repeated failed breakouts and pullbacks. RSI oscillated around the neutral 50 line throughout, and both EMAs flattened, reflecting a market in search of direction rather than trend.
Phase 4 — Powerful Advance to a Cycle High (Apr – Jun 2026) The range resolved decisively higher, with price advancing from the $245–$250 area to a cycle high near $320 by early June — a gain of roughly 30%. RSI pushed into firmly overbought territory above 75 near the peak, and both EMAs turned sharply higher, with the green EMA offering consistent support on pullbacks throughout the advance.
Phase 5 — Sharp Fibonacci Retracement (Jun 2026) From the early-June peak, price reversed hard, sliding from roughly $320 down to a low near $280 within a matter of weeks — a decline that traces neatly through the 0.382 ($290.25), 0.5 ($295.35), 0.618 ($300.44), and 0.786 ($307.70) retracement levels drawn off the April–June advance. This decline was accompanied by the largest single-day volume spike on the chart and an RSI drop back into oversold territory below 30.
Phase 6 — Base Repair Near the 50-Day EMA (Late Jun – Mid Jul 2026) Price stabilized in a tighter range around $280–$300, holding roughly at or above the 50-day EMA, while RSI recovered from its oversold extreme back toward the 45–55 zone — a constructive, if unspectacular, basing pattern.
Phase 7 — Breakout Through the Retracement Grid (Mid Jul 2026) Today's session represents a decisive break above the entire Fibonacci retracement structure in one move, clearing the 0.786 level at $307.70 and pushing to a fresh high above the early-June peak, closing at $327.32 near the session high of $328.53.
Moving Averages: Price Extending Sharply Above Both EMAs
Both the 20-day (green) and 50-day (red) EMAs remain in a clear upward slope, with the shorter EMA sitting comfortably above the longer one — a bullish alignment. However, today's close is now roughly $20 above the 20-day EMA, a wider gap than has typically persisted on this chart without at least a pause or partial mean reversion, which is worth watching on any near-term pullback.
Momentum Analysis: RSI Crosses Back Into Overbought Territory
RSI-14's push to 68.70, comfortably above its signal line at 55.58, marks the strongest momentum reading since the early-June peak that preceded the last major pullback. Unlike that prior instance, RSI has not yet breached the extreme 75–80 zone, leaving some room for further upside before momentum becomes historically stretched on this chart — but the parallel to the June setup (a fast RSI run-up into overbought right as price made new highs) is a useful reference for how quickly conditions can reverse.
Key Technical Levels
Resistance Levels
- $328.53 — today's intraday high and immediate resistance
- $343.63 — 1.618 Fibonacci extension of the April–June advance; the chart's primary upside target
- Round-number psychological resistance near $330–$335 on the way to the extension target
Support Levels
- $307.70 — 0.786 retracement level and today's breakout point; the most important support to hold for the move to remain valid
- $300.44 — 0.618 retracement and a secondary support shelf
- $297.59 — 50-day EMA
- $295.35 / $290.25 — 0.5 and 0.382 retracement levels, deeper support if the breakout fails
- $280.00 — origin of today's breakout move and the June consolidation low
Scenario Analysis
- Bullish Continuation (Constructive Case) — If AAPL holds above the $307–$308 breakout zone and RSI continues to hold above 60, price could push toward the $343.63 Fibonacci extension with relatively limited overhead resistance in between, particularly if volume continues to confirm the move.
- Consolidation Above the Breakout (Base Case) — A more measured outcome would see price digest today's sharp gain in a tighter range roughly between $308 and $328, allowing the 20-day EMA to catch up to price and RSI to cool from overbought without price giving back the breakout entirely — similar to the basing behavior seen after the January oversold low.
- Failed Breakout and Retest (Bearish Case) — A reversal back below the $307–$308 Fibonacci/EMA confluence, especially paired with RSI rolling back beneath its signal line, would suggest today's rally overextended and open the path back toward the $295–$300 zone, echoing the sharp June retracement from the prior cycle high.
Conclusion
Apple's decisive break above its entire Fibonacci retracement grid, combined with an RSI push back into overbought territory, marks the most aggressive single-session move on this chart since the June reversal — and effectively completes a round-trip back to fresh highs after that pullback. With price now extended meaningfully above both EMAs, the more important test may not be today's breakout itself but whether AAPL can hold the $307–$308 zone on any retest in the days ahead. A sustained hold above that level with RSI remaining constructive would keep the $343.63 extension target in play, while a quick failure back below it would suggest today's move needs more time to consolidate before the next leg higher.
This analysis is based solely on the price chart provided and is intended for educational/informational purposes. It is not financial advice — technical patterns can fail, and any investment decision should incorporate fundamental research, risk tolerance, and, where appropriate, consultation with a licensed financial advisor.


 Nov 19, 2026





 Please wait processing your request...