
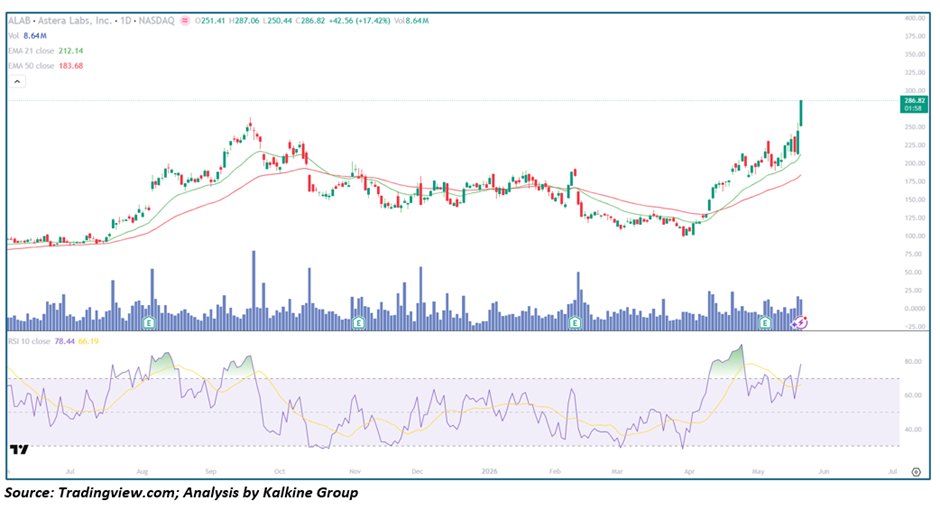
After months of volatile consolidation and sharp corrections following its explosive post-IPO rally, Astera Labs (ALAB) has re-emerged as one of the strongest momentum names in the AI infrastructure and semiconductor space. The stock closed at 286.82 (+17.42%) after an aggressive breakout session that pushed price to fresh recovery highs, signaling renewed institutional Demand and a potential continuation of its broader uptrend. With price trading far above both the EMA-21 (212.14) and EMA-50 (183.68), combined with a surging RSI and expanding Volume, ALAB appears to be entering a new momentum expansion phase.
Key Highlights
- ALAB closed at 286.82, gaining +17.42% in a powerful breakout session
• Price traded between 250.44 and 287.06 intraday, reflecting aggressive buying momentum
• The stock is trading well above the EMA-21 (212.14) and EMA-50 (183.68), confirming strong bullish structure
• RSI-10 surged to 78.44, signaling strong momentum and sustained buying pressure
• Volume jumped to 8.64M shares, indicating institutional participation behind the move
• The stock has rallied sharply from the March–April lows near 100–120
• Current price action suggests a transition from recovery mode into full breakout acceleration
Trend Structure: From IPO Euphoria to Momentum Reacceleration
Phase 1 — Post-IPO Expansion (Jul – Sep 2025)
Following its public market debut, ALAB experienced an explosive momentum-driven rally fueled by AI infrastructure enthusiasm.
Key characteristics included:
- Rapid price acceleration above moving averages
• Heavy speculative and institutional volume
• RSI repeatedly entering overbought territory
• Strong higher-high breakout behavior
The stock eventually peaked near the 250–260 zone during this initial expansion phase.
Phase 2 — Volatility & Distribution (Oct 2025 – Feb 2026)
After the initial euphoria, ALAB entered a prolonged corrective structure:
- Lower highs developed across multiple months
• EMA-21 rolled beneath price and flattened
• Selling pressure intensified during failed rallies
• Price repeatedly tested the EMA-50 and eventually broke below it
This phase reflected valuation compression and profit-taking after the initial AI-driven surge.
Phase 3 — Capitulation & Bottom Formation (Mar – Apr 2026)
The correction accelerated into a final washout phase:
- Price dropped toward the 100–120 zone
• RSI entered oversold territory
• Selling volume spiked aggressively
• Volatility compressed after the decline stabilized
Importantly, the stock began forming a rounded base rather than continuing lower — an early sign that institutional accumulation was returning.
Phase 4 — Recovery & Breakout Expansion (Apr – May 2026)
The current phase represents a decisive technical shift.
ALAB has now:
- Reclaimed both EMA-21 and EMA-50 decisively
• Printed multiple breakout candles with strong volume
• Formed higher highs and higher lows
• Accelerated vertically following recent consolidation
Today’s +17% breakout strongly suggests momentum expansion rather than a short-covering bounce.
Moving Averages: Powerful Bullish Alignment Restored
The Moving Average structure has shifted decisively bullish.
EMA-21 (212.14)
- Rising sharply upward
• Acting as immediate trend support
• Successfully supported recent pullbacks
EMA-50 (183.68)
- Now turning higher after months of flattening
• Reinforces the medium-term recovery trend
• Sits well below current price, reflecting trend acceleration
The wide separation between current price and moving averages confirms strong momentum, though it also increases the probability of near-term volatility or consolidation after such an extended move.
Momentum Analysis: RSI Signals Aggressive Trend Strength
RSI-10 at 78.44 reflects extremely strong bullish momentum.
While RSI above 70 often suggests overbought conditions, momentum leaders during powerful expansion phases can remain overbought for extended periods.
Current RSI behavior suggests:
- Buyers remain firmly in control
• Momentum is accelerating, not fading
• No meaningful bearish divergence is currently visible
However, traders should monitor for:
- Failed breakout candles
• RSI divergence
• Heavy Reversal volume
as potential early warning signs of exhaustion.
Volume Analysis: Institutional Buying Appears Active
Volume behavior strongly confirms the breakout.
Key observations:
- Today's breakout candle occurred on exceptionally strong volume
• Recent up-days consistently show higher participation than down-days
• Volume expansion aligns with key resistance breakouts
This type of volume-price behavior is often associated with:
- Institutional accumulation
• AI-sector momentum inflows
• High-conviction breakout buying
At present, the rally appears demand-driven rather than speculative alone.
Key Technical Levels
Resistance Levels
- 300 — major psychological resistance
• 325–340 — breakout extension zone
• 375–400 — long-term expansion target
Support Levels
- 250–260 — recent breakout support
• EMA-21 at 212.14 — primary dynamic support
• EMA-50 at 183.68 — structural trend support
• 160–170 — prior consolidation base
Scenario Analysis
- Bullish Continuation (Primary Case)
If ALAB sustains above the 250–260 breakout zone:
→ Momentum could extend rapidly toward 325–350
→ RSI may remain elevated during expansion
→ AI infrastructure momentum could continue fueling inflows
- Consolidation Phase (Healthy Outcome)
After a near-vertical rally, the stock may pause:
→ Sideways range between 240–290
→ RSI cools gradually
→ EMA-21 catches up beneath price
This would strengthen the broader bullish structure.
- Bearish Reversal (Risk Case)
A failed breakout below 250 with heavy selling volume could trigger profit-taking:
→ First downside target: EMA-21 near 212
→ Below EMA-50 would weaken the recovery trend materially
Currently, this remains a secondary scenario.
Conclusion: ALAB Reclaims Leadership Status
Astera Labs has rapidly transitioned from correction mode back into high-momentum leadership territory within the semiconductor and AI infrastructure space.
The technical structure now reflects:
- Strong bullish moving average alignment
• Explosive breakout momentum
• Institutional-quality volume expansion
• Higher highs and higher lows
• Renewed AI-sector leadership characteristics
The framework moving forward is clear:
- Above 250–260 → bullish momentum remains dominant
• Above 300 → breakout acceleration likely
• Below EMA-21 → momentum caution increases
For momentum traders, ALAB is once again behaving like a premier AI infrastructure leader, with price action suggesting that institutional demand has returned aggressively following months of consolidation and correction.


 Please wait processing your request...