
Key Highlights
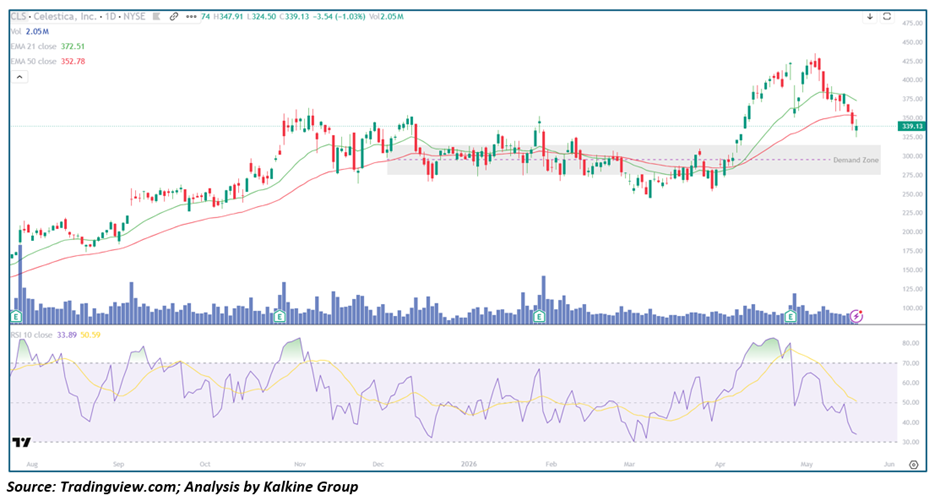
- Celestica (CLS) is trading near $339.13, down sharply from recent highs of ~$440 — a correction of over 22% in a matter of weeks
- Price has broken below EMA-21 (~$372.51) and is fast approaching EMA-50 (~$352.78), putting both moving averages under threat
- RSI-10 at 33.89 is approaching oversold territory and sits well below the signal line at 50.59, signalling accelerating downside momentum
- A clearly marked Demand Zone on the chart sits in the $290–$305 range — a historically significant support area that previously acted as a long base
- Volume remains steady but not extreme, suggesting institutional distribution rather than panic retail selling
Trend Structure: A Powerful Uptrend Under Serious Pressure
Celestica built one of the strongest charts in the contract electronics Manufacturing space over the past year. From the $275–$305 Demand Zone that held for most of 2024 through early 2025, the stock broke out aggressively and rallied all the way to ~$440 by April 2026 — a gain of over 45% from the breakout point alone.
That uptrend, however, is now being tested. The sharp Reversal from the $440 highs has been swift and technically damaging. Price has sliced through the EMA-21 with conviction and is now trading at $339 — a level that is beginning to close in on the EMA-50. What was a clean, well-supported rally is now showing signs of distribution, with sellers clearly in control over the past several weeks.
The critical question for bulls is whether the EMA-50 and the broader $325–$350 zone can provide a floor, or whether the stock continues lower toward the Demand Zone.
RSI Setup: Fast Approaching Oversold — Watch for a Curl
The RSI-10 at 33.89 is one of the more notable features on the chart right now. It has dropped sharply from overbought readings above 70 that were registered in late March and early April — tracking the top of the price rally almost perfectly. The signal line at 50.59 now sits far above the RSI line, confirming the speed and severity of the momentum deterioration.
At 33.89, RSI is approaching — but not yet in — classic oversold territory below 30. Historically on this chart, RSI readings that dip into the 30–35 range have preceded at least short-term bounces, as seen in the October and December 2025 periods. A continued move below 30 would place the stock in the same oversold condition that has consistently attracted buyers in prior cycles.
The key trigger to watch is a curl upward in the RSI-10 line while it remains below the signal line — that sequence has historically marked early-stage recoveries on CLS.
Moving Averages: From Support to Resistance
The Moving Average picture has shifted meaningfully:
- EMA-21 (~$372.51) — price broke below this level convincingly and it has now flipped to resistance. Any rally attempt will face selling pressure at this level before it can be reclaimed
- EMA-50 (~$352.78) — this is the next critical level. Price is currently $13 below it and closing in fast. The EMA-50 has not been meaningfully tested since the January 2026 breakout, making this an important moment for trend integrity
- Demand Zone (~$290–$305) — the longer-term support base that defined the prior consolidation for nearly a year. A break below the EMA-50 would likely bring this zone back into focus as the next major downside target
The EMA-50 at $352 is the line in the sand. A close back above it would signal the pullback is corrective. A sustained break below it would shift the medium-term outlook to bearish.
Volume: Steady Selling, Not Capitulation
Volume on the recent decline has been consistent but not the kind of spike that typically marks a final washout. The largest volume bar visible in recent sessions appears around the initial breakdown, which is consistent with a distribution phase — sellers offloading into any bounce rather than a single capitulation event.
The absence of a climactic high-volume selloff means the bottom may not yet be in. True exhaustion bottoms on CLS, as seen in prior lows, tend to coincide with at least one elevated-volume session followed by a reversal candle. That pattern has not yet appeared on this chart.
Key Technical Levels and Scenarios
Resistance Levels
- $352–$355 — EMA-50 and immediate overhead resistance
- $372–$375 — EMA-21 and key recovery level
- $395–$400 — prior consolidation and psychological level
- $440+ — all-time high and ultimate bull target
Support Levels
- $325–$330 — near-term cushion and round number support
- $305–$310 — upper edge of the Demand Zone
- $290–$300 — core Demand Zone; major long-term support
Scenarios
- Bounce and Recovery (Primary Case) — RSI enters oversold territory, price finds support in the $325–$340 range, and a relief rally develops back toward the EMA-50 at $352 and then the EMA-21 at $372. Reclaiming both EMAs would be required to declare the uptrend back on track.
- Consolidation Around EMA-50 (Secondary Case) — Price grinds sideways between $330–$355, digesting the sharp decline while momentum stabilises. This would be a constructive outcome, setting up a potential re-entry into the uptrend if the broader market stabilises.
- Continuation to Demand Zone (Risk Case) — EMA-50 fails to hold, selling pressure accelerates, and CLS revisits the $290–$305 Demand Zone. This scenario becomes more likely if the broader semiconductor and AI hardware selloff intensifies — particularly in the wake of this week's Nvidia Earnings.
Conclusion: Uptrend Wounded But Not Dead — EMA-50 Is the Decisive Level
Celestica is at a technical crossroads. The structural uptrend that delivered exceptional gains through early 2026 is under its most significant pressure since the breakout began. Price has broken below the EMA-21, RSI is nearing oversold territory, and the EMA-50 is the last major line of defence before a deeper Retracement becomes the base case.
The good news for bulls is that the long-term Demand Zone at $290–$305 remains intact and has proven to be a reliable floor historically. If the current weakness is driven by macro headwinds rather than a fundamental deterioration in Celestica's Business, a recovery back toward the EMAs remains plausible once selling pressure exhausts.
For now, the weight of evidence favours caution — but an oversold RSI curl combined with a defence of the EMA-50 would be a compelling early signal that the worst of the correction is behind. Watch the $352 level closely in the sessions ahead.


 Please wait processing your request...