
 CA
 NZ
 UK
 AU
 IND

 US

 Share
 X (Formerly Twitter)
 Whatsapp
 Facebook
 LinkedIn
 Telegram
 Email This Article
 Copy Link
 Summarize with AI
 Chat GPT
 Perplexity

The recent rally across cloud infrastructure, hyperscale data center, and AI infrastructure stocks has encountered meaningful profit-taking, with Riot Platforms (NASDAQ: RIOT), Core Scientific (NASDAQ: CORZ), and Wolfspeed (NYSE: WULF) all pulling back sharply after posting impressive gains over the past several months. While each stock has declined significantly in recent sessions, their longer-term technical structures remain largely constructive, with price action approaching key moving averages that could determine whether the recent weakness develops into a healthy correction or the beginning of a broader trend reversal.
Although momentum has weakened considerably, all three names continue to trade near important technical inflection points where buyers are likely to re-emerge if the broader AI and digital infrastructure theme remains intact.
Riot Platforms (NASDAQ: RIOT) — Strong Uptrend Faces Its First Major Technical Test Following a Sharp Breakdown Below the 20-Day EMA
Key Highlights
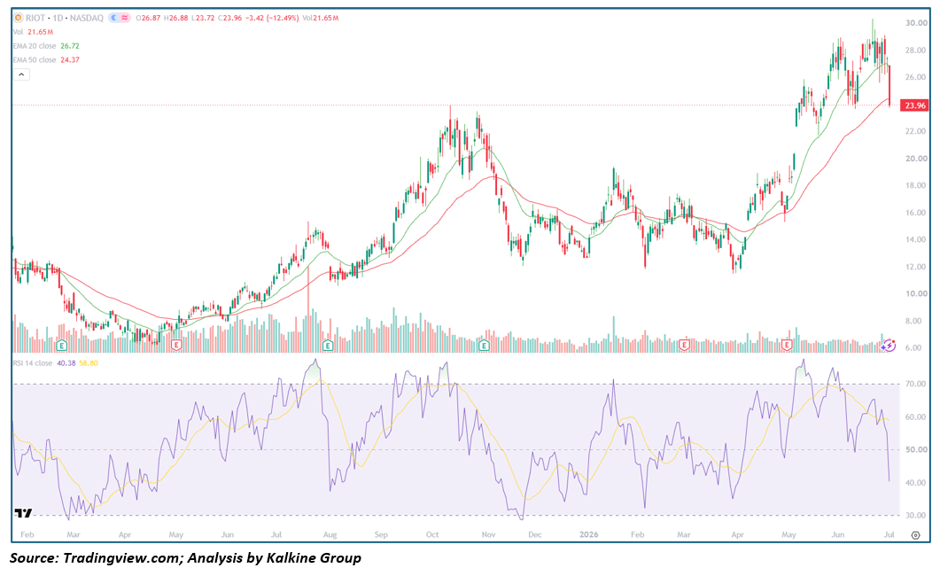
• RIOT closed at $23.96, declining 12.49% on heavy trading volume after suffering one of its largest single-day declines in recent months.
• Price has fallen below the 20-day EMA ($26.72) and is now testing the 50-day EMA ($24.37), signaling weakening short-term momentum.
• RSI has dropped to approximately 40, moving below the midpoint and indicating growing bearish momentum.
• The stock rallied nearly 100% from April through June before encountering aggressive profit-taking near the $29–30 resistance area.
• Volume expanded sharply during the decline, suggesting institutional selling and elevated market participation.
Trend Structure
RIOT established a strong recovery beginning in April after completing a prolonged consolidation phase near yearly lows. The breakout above both the 20-day and 50-day EMAs triggered a sustained bullish advance characterized by higher highs and higher lows. Buyers consistently defended short-term pullbacks, allowing the stock to trend steadily toward the psychological $30 level.
Momentum accelerated significantly throughout May and June, supported by improving volume and strong price action. However, repeated failures near the $29–30 resistance zone created a short-term double-top formation, increasing the likelihood of profit-taking.
The latest large bearish candle represents the first meaningful technical breakdown of the current rally. Price has decisively lost the 20-day EMA and is now testing the rising 50-day EMA, which serves as the next major support level. Meanwhile, RSI has slipped below 50, reflecting fading buying momentum and increasing downside pressure.
Key Technical Levels
Resistance
• $26.70 – 20-day EMA
• $28–30 – Major resistance
Support
• $24.30 – 50-day EMA
• $22.50–23.00 – Previous breakout zone
• $20.00 – Major structural support
Outlook
The broader uptrend remains technically valid as long as RIOT holds above the 50-day EMA. A successful defense of current support could produce another attempt toward the recent highs. However, a decisive close below the 50-day EMA would confirm a deeper correction and potentially shift market sentiment toward the bearish side.
Core Scientific (NASDAQ: CORZ) — Bullish Long-Term Structure Remains Intact Despite Heavy Distribution Near Recent Highs
Key Highlights
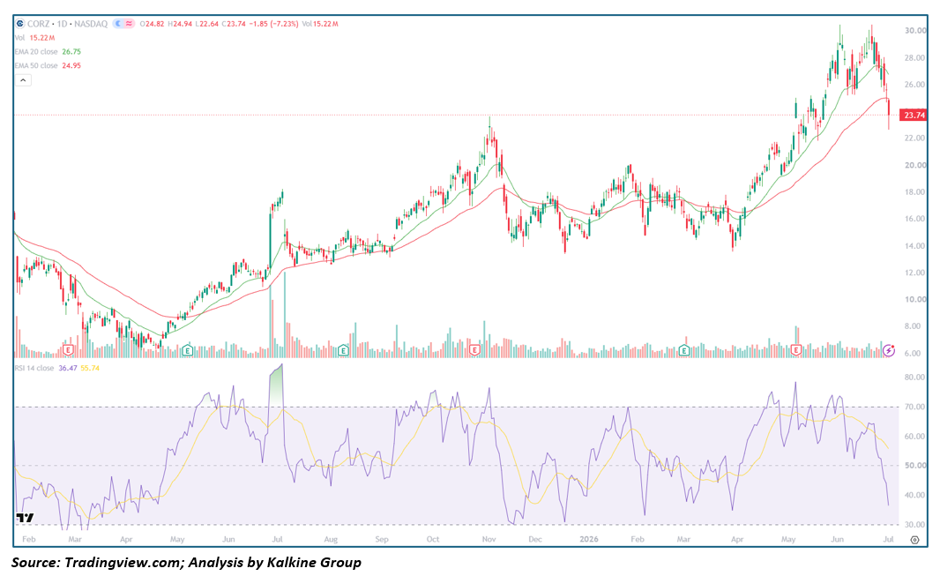
• CORZ finished at $23.74, falling 7.23% after extending its recent pullback from multi-month highs.
• Price has slipped beneath the 20-day EMA ($26.75) and is currently testing the 50-day EMA ($24.95).
• RSI has declined toward 36, indicating momentum has weakened significantly and is approaching oversold territory.
• The stock gained steadily throughout the second quarter before profit-taking accelerated near the $30 resistance area.
• Selling volume has increased noticeably during the correction, highlighting active distribution after a strong advance.
Trend Structure
CORZ has maintained one of the strongest intermediate-term recoveries within the digital infrastructure sector. Following a lengthy accumulation phase, buyers gradually pushed the stock above both moving averages, initiating a sustained rally supported by improving volume and positive momentum.
The trend strengthened considerably during April and May as institutional buying drove the stock toward fresh yearly highs. Throughout the advance, the 20-day EMA acted as reliable dynamic support, allowing price to maintain a consistent sequence of higher highs and higher lows.
Recent trading, however, reflects a notable shift in momentum. Multiple failed attempts to sustain gains above $29–30 attracted profit-taking, leading to a sharp decline that has now brought price back toward the 50-day EMA. RSI has also broken below the midpoint, suggesting sellers currently hold short-term control.
Despite this weakness, the broader bullish trend has not yet been invalidated. The 50-day EMA remains upward sloping, and a successful defense of this support could allow buyers to rebuild momentum after the current correction.
Key Technical Levels
Resistance
• $26.70 – 20-day EMA
• $29–30 – Major resistance
Support
• $24.90 – 50-day EMA
• $22–23 – Previous breakout support
• $20 – Long-term support
Outlook
CORZ is undergoing a healthy technical correction following an extended rally. The next several sessions will likely determine whether buyers successfully defend the 50-day EMA or whether additional selling pressure pushes the stock toward deeper support levels. Until the 50-day EMA is decisively broken, the longer-term bullish structure remains intact.
Wolfspeed (NYSE: WULF) — Momentum Cools as Strong Multi-Month Rally Enters a Healthy Consolidation Phase
Key Highlights
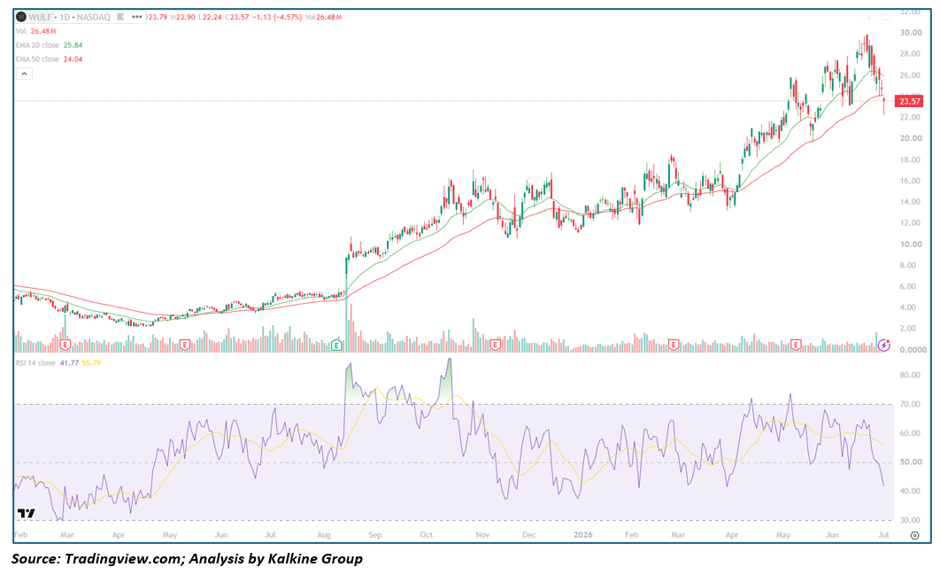
• WULF closed at $23.57, declining 4.57% as profit-taking continued following its recent surge toward $30.
• Price has fallen below the 20-day EMA ($25.84) while approaching the 50-day EMA ($24.04).
• RSI has retreated to approximately 42, confirming slowing momentum but remaining above oversold conditions.
• The stock delivered a substantial rally from April through June before encountering selling pressure near major resistance.
• Trading volume increased during the latest decline, reflecting active profit-taking after the extended advance.
Trend Structure
WULF spent much of the previous year building a broad accumulation base before breaking decisively above its major moving averages. That breakout marked the beginning of a sustained bullish trend, supported by improving volume and steadily rising momentum.
Throughout the second quarter, buyers maintained firm control, producing a well-defined sequence of higher highs and higher lows. The 20-day EMA consistently acted as dynamic support, allowing price to climb steadily toward the important psychological resistance around $30.
The recent decline represents the first meaningful pullback after an extended advance. Price has now slipped below the 20-day EMA while approaching the 50-day EMA, where buyers may attempt to stabilize the trend. RSI has also fallen below 50, indicating momentum has weakened but not yet reached oversold conditions.
From a technical perspective, the current move appears more consistent with a normal correction than a complete trend reversal. However, sustained trading below the 50-day EMA would significantly weaken the bullish outlook and increase the probability of a broader retracement.
Key Technical Levels
Resistance
• $25.80 – 20-day EMA
• $28–30 – Major resistance zone
Support
• $24.00 – 50-day EMA
• $22–23 – Previous breakout support
• $20 – Major long-term support
Outlook
WULF remains in a constructive longer-term uptrend despite the recent weakness. Holding above the 50-day EMA would preserve the bullish structure and potentially set the stage for another advance once selling pressure subsides. Conversely, a decisive break below this support would likely trigger a deeper correction before buyers attempt to regain control of the trend.


 Nov 13, 2026





 Please wait processing your request...