
Corvex, (Nasdaq:MOVE) saw its US-listed shares jump 27.57% on 13 May 2026 to USD 19.25 on relatively modest absolute Volume — a profile suggesting concentrated rather than broad-based participation.
Key Highlights
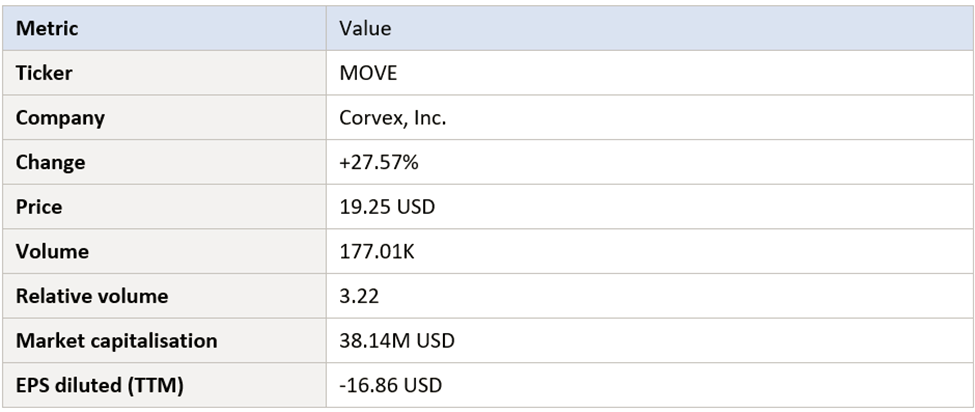
- MOVE closed the screener at USD 19.25, up 27.57% on the session.
- Volume of 177.01K shares represented 3.22× normal activity.
- Market Capitalisation was reported at approximately USD 38.14 million.
- Trailing twelve-month diluted EPS was -USD 16.86.
- Low-volume small-caps can move sharply on small absolute order flows.
What Happened
Corvex, Inc. (NASDAQ:MOVE) was among the gainers for 13 May 2026. The screener recorded a single-session change of 27.57% to USD 19.25, with reported volume of 177.01 thousand shares — modest in absolute terms but equivalent to 3.22 times the stock's normal trading pace.
With a market capitalisation of approximately USD 38.14 million, Corvex sits within the micro-cap segment. Such a market cap, paired with relatively low absolute trading volume, often points to a tightly held Shareholder base and limited free float.
Investors should remember that the screener captures only one snapshot of the session and that the intraday range may have been considerably wider, particularly in lightly-traded names.
Market Context
The 13 May 2026 session was marked by broad-based speculative activity across the US small-cap and micro-cap segments. While the highest-profile gainers featured deeply micro-cap names with extreme percentage moves, more moderate-sized small-caps like Corvex also participated, though with less extreme price changes and more measured volume profiles.
Within this context, the combination of a modest absolute volume figure and an elevated relative volume reading is a recurring pattern for stocks that occasionally appear on gainer screeners. Periods of broad-based retail attention can lift a wide range of names — even those that normally trade with limited activity — by exposing them to additional eyeballs and order flow.
Sector-wise, MOVE has historically been associated with the technology space, though the screener does not provide granular details about its operating Business. As a result, this article does not speculate beyond what is visible.
More broadly, the US market has seen a continued retail interest in lower-priced and lower-cap names, particularly during periods when broader benchmarks are range-bound and traders look to small-caps for short-duration opportunities.
Company Overview
Corvex, Inc. is a US-listed company, under the ticker MOVE. As of the 13 May 2026 screener snapshot, the company had a market capitalisation of approximately USD 38.14 million.
The trailing twelve-month diluted EPS figure of -USD 16.86 is unusually large in magnitude. As with similar figures in other micro-caps, this number is likely influenced by share count changes and one-off items, and should not be interpreted in isolation. A complete Fundamental Analysis would require examining the company's income statement, Capital-structure/">Capital Structure history, and any recent corporate actions.
From a market-behaviour standpoint, Corvex's profile — a sub-USD 50 million market cap with limited daily volume — is consistent with that of a thinly-traded micro-cap.
Screener Data
MOVE's reported volume of 177,010 shares is small relative to most of the day's other gainers, even though the relative-volume reading of 3.22 indicates that activity was clearly elevated for this particular name. This pattern is consistent with a thinly-traded stock where individual orders can have an outsized influence on price.
The market capitalisation of approximately USD 38 million places MOVE within a segment of the market where information asymmetry can be material. Limited analyst coverage and constrained trading depth mean that retail-driven moves can have a larger relative impact than they would in better-followed names.
The trailing diluted EPS of -USD 16.86 is striking and likely reflects capital structure dynamics rather than purely operational performance. Investors should be cautious about treating such per-share figures at Face Value.
Risks to Watch
Thin Liquidity
Stocks trading with absolute daily volumes in the low hundreds of thousands of shares can experience wide bid-ask spreads and slippage during fast markets. Execution prices may differ materially from quoted levels.
Disclosure and visibility
Smaller, less-followed names typically receive limited analyst coverage. Investors should review the company's filings directly rather than relying solely on screener-level data.
Reversion risk
Sharp single-session moves in thinly-traded names are frequently followed by retracements as concentrated buyers exit and the market re-prices the stock toward broader fundamentals.
Trading Patterns and Liquidity
Beyond the headline +27.57% change, the trading pattern provides a useful lens on how Corvex, Inc. actually moved through the session. The combination of a 19.25 USD reference level, reported volume of 177.01K, and a relative volume reading of 3.22 is informative in itself. Each of these figures captures a different facet of the market's reaction: price reflects the marginal valuation, volume measures aggregate participation, and relative volume contextualises that participation against the stock's own history.
In a market cap band reported at 38.14M USD, sustained moves typically require either a meaningful change in the perceived fundamental story or a substantial shift in the composition of the stock's investor base. One-day spikes that are not anchored in confirmed catalysts can be informative about market psychology but provide limited evidence about durable value creation. Traders evaluating MOVE in the days that follow will want to watch whether the elevated volume profile is sustained, whether intraday ranges narrow, and whether bid-ask spreads tighten as the session's enthusiasm normalises.
Liquidity considerations also matter. When a stock's traded volume runs at multiples of its average, the order book can briefly look very different from its usual state. In particular, market depth — the size of resting orders at each price level — can appear larger than it really is during the spike and thinner than it really is once the rush fades. For MOVE, that means execution conditions encountered during the 13 May 2026 session may not be representative of typical days, and investors should plan position sizing and exit strategies accordingly.
How This Move Compares to Other Top Gainers
Placing MOVE's +27.57% move in context with other names on the 13 May 2026 Top Gaining US Stocks screener helps highlight what made the session distinctive. On the same day, leaderboard names ranged from deeply micro-cap issuers such as Dreamland Limited (TDIC) and Fitness Champs Holdings (FCHL) to larger small- and mid-caps like Ouster (OUST) and SELLAS Life Sciences (SLS). That breadth — both in sector and in market capitalisation — suggests the day's risk-on tone was broadly distributed rather than confined to a single theme.
Within that mixed cohort, MOVE sat alongside companies from healthcare, advanced Manufacturing, energy transition, and financial services. Although each of these names has its own operating story, their simultaneous appearance on the screener illustrates a pattern frequently observed in US markets: when small- and micro-cap appetite returns, capital tends to disperse across themes rather than concentrate in one. That dispersion can itself be a signal worth tracking, because it differentiates broad-based risk-on sessions from sentiment events focused on a single sector.
The relative-volume reading of 3.22 for MOVE should be read against the wide range observed in the day's gainers. Some names featured relative volumes in the high 20s, 30s, and even above 70, while others showed more moderate spikes in the 2–6 range. Where a particular stock sits in that distribution offers a clue about how unusual the day's activity was for that specific name — a more meaningful comparison than focusing solely on the headline percentage gain.
Investor Outlook
For MOVE, the 13 May 2026 session highlights the way thinly-traded small-caps can experience significant percentage moves on relatively modest absolute volume. Whether the move marks the start of a sustained re-rating or a single-session anomaly depends on factors that are not visible from screener data alone.
Long-term investors evaluating Corvex would typically focus on operating performance, capital structure, and any disclosures regarding strategic direction. Without that context, the screener move offers limited fundamental insight.
Short-term traders may continue to monitor the stock for follow-through patterns, paying particular attention to liquidity conditions and to how the price behaves on subsequent sessions with more — or less — volume.
Ultimately, MOVE's session is a useful reminder that screener-level gains can vary significantly in their underlying interpretation depending on the stock's typical liquidity profile.


 Please wait processing your request...