
 CA
 NZ
 UK
 AU
 IND

 US

 Share
 X (Formerly Twitter)
 Whatsapp
 Facebook
 LinkedIn
 Telegram
 Email This Article
 Copy Link
 Summarize with AI
 Chat GPT
 Perplexity

Today's session drew a clear line between the bitcoin-mining names and the rest of the crypto-equity complex. Cipher Digital (NASDAQ: CIFR), Riot Platforms (NASDAQ: RIOT), and TeraWulf (NASDAQ: WULF) all rallied sharply, each pushing back above its 20- and 50-day EMAs after multi-week pullbacks. On the other side, Strategy Inc. (NASDAQ: MSTR) suffered the steepest decline in the group, extending a slide that has taken it to its lowest levels of the year, while Coinbase (NASDAQ: COIN) and Bitdeer Technologies (NASDAQ: BTDR) posted smaller declines and remain below both moving averages.
Strategy Inc. (NASDAQ: MSTR) — Steepest Decline in the Group, Trading Near 2026 Lows
Key Highlights
- MSTR trading at $93.64, down 6.37% ($6.37) on volume of 13.14M shares, after ranging between $92.34 and $97.51 on an open at $97.00.
- Price remains well below both the 20-day EMA ($99.87) and the 50-day EMA ($115.45), with the gap to the 50-day EMA especially wide.
- RSI sits at roughly 40.59, with the signal line at 40.55 — essentially flat and below the midpoint, reflecting persistent weak momentum.
- MSTR has been in a downtrend for most of the past year, falling from an October 2025 high near $300 into a February 2026 low near $130, staging a brief rally into a May 2026 high near $200, and then resuming its decline into the current area near recent lows.
- Today's decline is the sharpest percentage move among all six names covered.
Trend Structure MSTR's chart shows a persistent multi-month downtrend, briefly interrupted by a spring rally that topped out near $200 in May before resuming lower. The stock is now trading near its worst levels of the past year, with today's session extending that weakness. 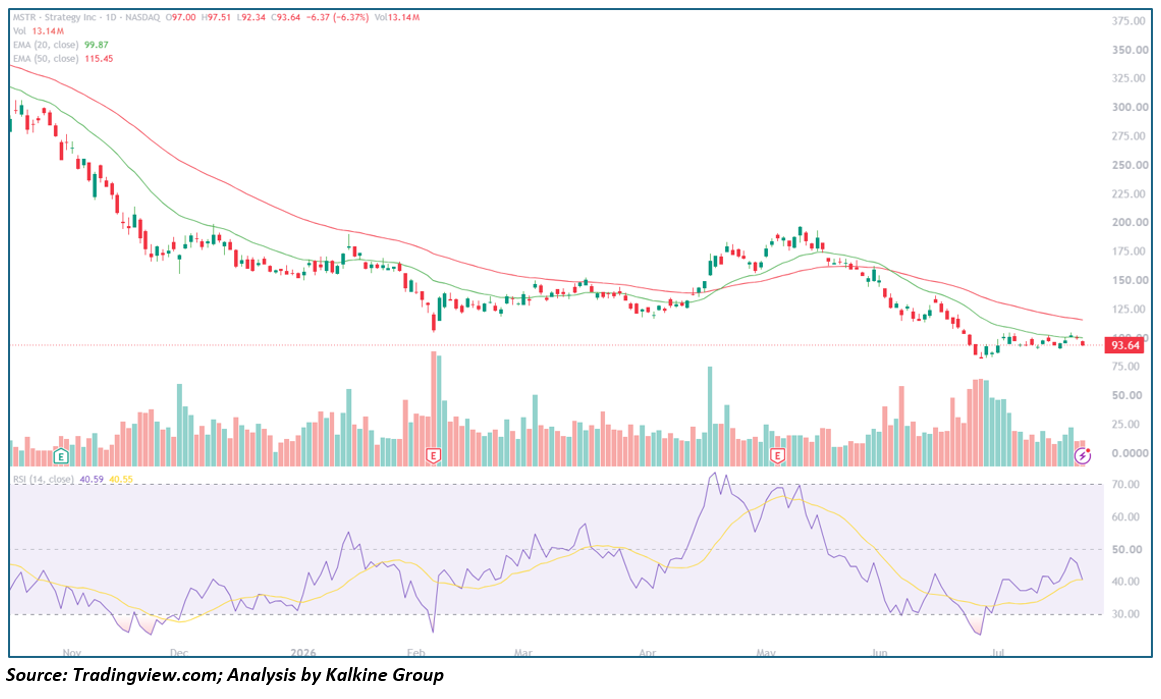
Key Technical Levels Resistance
- $99.87 – 20-day EMA
- $115.45 – 50-day EMA
- ~$130.00 – February 2026 low (former support, now overhead) Support
- ~$90.00 – Recent multi-month low area
- ~$85.00 – Psychological round-number level
Outlook MSTR remains the weakest name in the group, with price well below both EMAs and RSI stuck near the midpoint. A recovery above the 20-day EMA near $100 would be needed just to suggest stabilization; without that, the path of least resistance stays lower.
Cipher Digital Inc. (NASDAQ: CIFR) — Largest Gain in the Group, Sharp Reversal Back Above the EMAs
Key Highlights
- CIFR trading at $25.81, up 5.50% ($1.34) on volume of 29.15M shares, after ranging between $23.94 and $26.84 on an open at $24.17.
- Price has surged back above both the 20-day EMA ($22.30) and the 50-day EMA ($22.09), reversing a sharp pullback from recent highs.
- RSI has jumped to roughly 59.54, with the signal line at 45.04 — a decisive crossover following weeks of declining momentum.
- CIFR rallied from an April 2026 low near $11 to a July 2026 high near $30, then pulled back sharply to a recent low near $17 before today's strong reversal.
- Today's percentage gain is the largest among the six names covered, and the volume behind it is the heaviest in the group.
Trend Structure CIFR's chart shows a powerful advance from an April 2026 low into a July 2026 high near $30, followed by a sharp multi-week pullback that tested Fibonacci retracement support near the 61.8% level before today's sharp rally back above both EMAs. 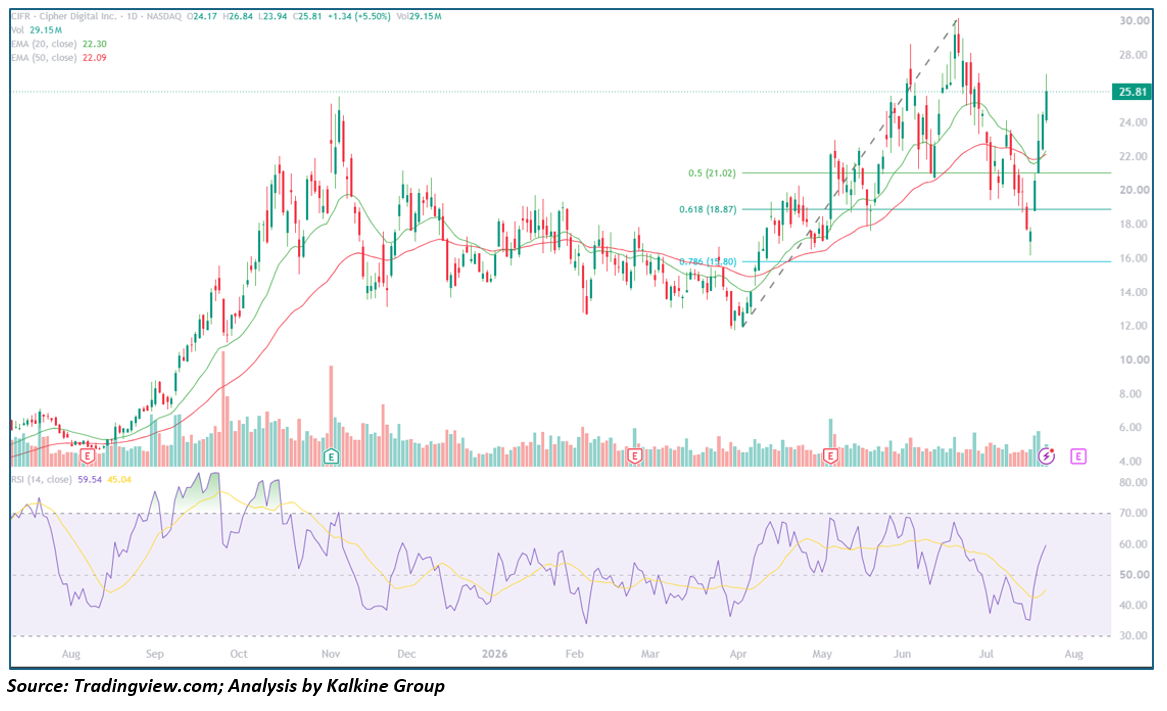
Key Technical Levels Resistance
- ~$27.00 – Recent swing high (July pullback level)
- ~$30.00 – July 2026 cycle high Support
- $22.30 – 20-day EMA
- $22.09 – 50-day EMA
- ~$18.87 – 61.8% retracement level
Outlook CIFR's sharp reversal, on the heaviest volume in the group, is a strong signal that the recent pullback may have found a floor. A follow-through close above $27 would put the July highs back in range; a fade back below the EMA cluster near $22 would suggest today's strength needs more confirmation.
Coinbase Global, Inc. (NASDAQ: COIN) — Continues to Trade Below Both EMAs Despite Sitting Well Off Its Lows
Key Highlights
- COIN trading at $161.12, down 3.01% ($5.00) on volume of 4.29M shares, after ranging between $158.88 and $165.74 on an open at $163.12.
- Price remains below both the 20-day EMA ($162.51) and the 50-day EMA ($168.27), though the gap to the 20-day EMA is now narrow.
- RSI sits at roughly 48.52, with the signal line at 49.39 — both near the midpoint, consistent with a stock searching for direction.
- COIN has traded in a wide, choppy range for most of 2026, falling from a February high near $260 to a range roughly between $140 and $220, with a recent bounce off July lows near $140 that today's session is partially unwinding.
- Today's decline erases a portion of the stock's recent bounce off its multi-month lows.
Trend Structure COIN's chart shows a steady decline from a February 2026 peak into a wide, choppy range through the spring and summer, with a recent bounce off a July low near $140 that has now stalled just below the 20-day EMA. 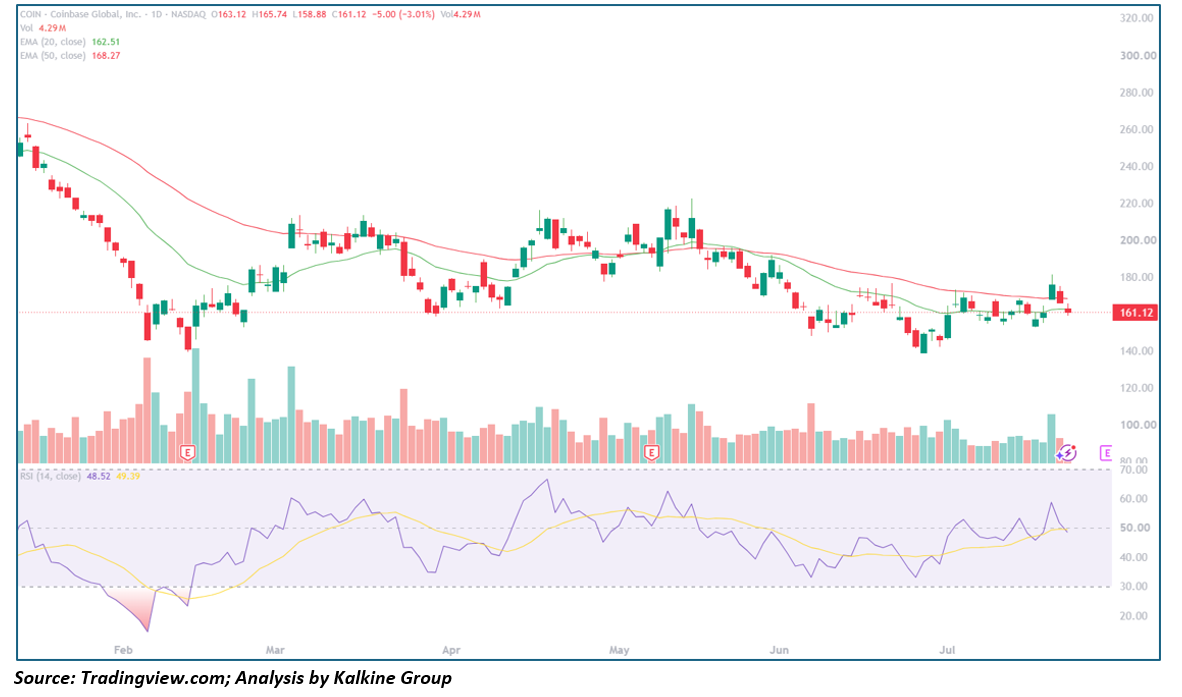
Key Technical Levels Resistance
- $162.51 – 20-day EMA
- $168.27 – 50-day EMA
- ~$180.00 – Recent bounce high Support
- ~$150.00 – Recent consolidation zone
- ~$140.00 – July 2026 low
Outlook COIN's pullback keeps the stock below both EMAs, but the decline is modest relative to the stock's recent range. Reclaiming the $162–$168 EMA cluster would suggest the bounce off the July lows has more room to run; a slide back toward $140 would put the recent low back in play.
TeraWulf Inc. (NASDAQ: WULF) — Solid Bounce, But Still Below Both EMAs
Key Highlights
- WULF trading at $20.06, up 2.92% ($0.57) on volume of 22.17M shares, after ranging between $19.36 and $20.66 on an open at $19.36.
- Price remains below both the 20-day EMA ($21.29) and the 50-day EMA ($22.31), though today's rally has narrowed the gap meaningfully.
- RSI has climbed to roughly 42.61, with the signal line at 38.84 — RSI has crossed above its signal line despite still sitting below the midpoint.
- WULF rallied from an October 2025 base near $12 into a May 2026 high near $30, then declined sharply through June and July into a low near $16.50 before today's bounce.
- Today's gain is a meaningful step toward reversing the recent slide, though price has not yet cleared either EMA.
Trend Structure WULF's chart shows a strong advance from an October 2025 low into a May 2026 peak, followed by a steep multi-week decline into a July low near $16.50. Today's bounce is the strongest single-day move since that decline began, though the stock remains below both EMAs. 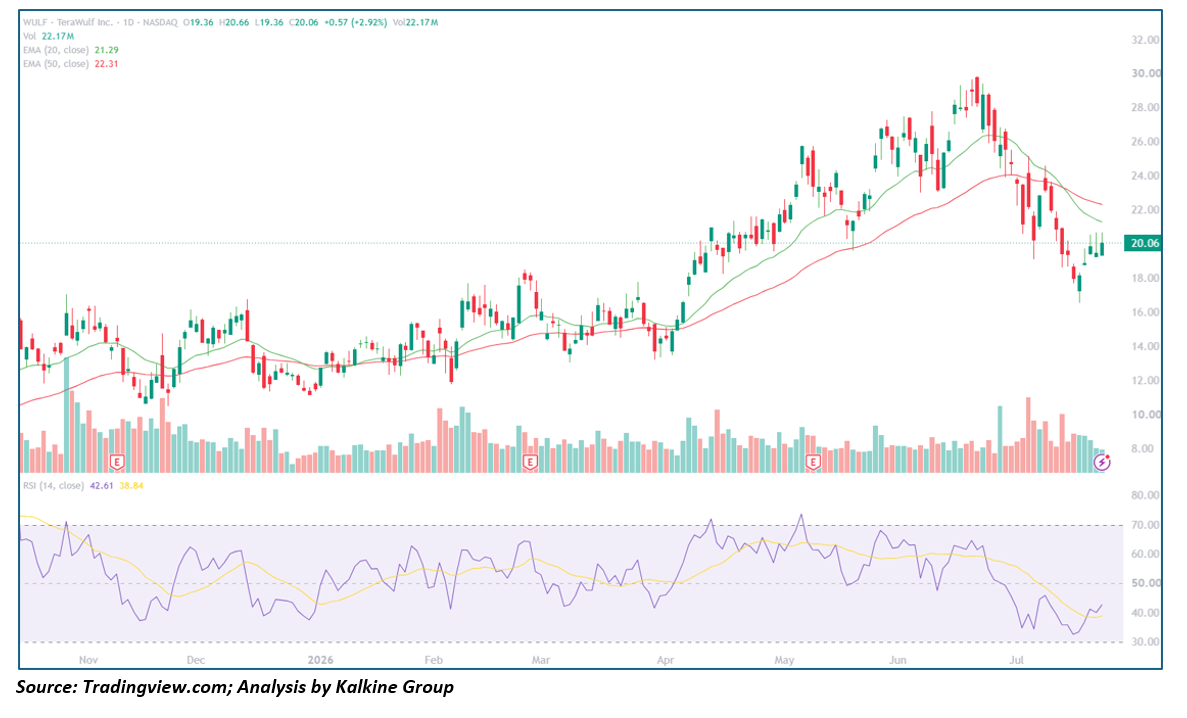
Key Technical Levels Resistance
- $21.29 – 20-day EMA
- $22.31 – 50-day EMA
- ~$24.00 – Prior consolidation zone Support
- ~$18.00 – Recent pullback zone
- ~$16.50 – July 2026 low
Outlook WULF's bounce is encouraging, but the stock needs to clear the EMA cluster near $21–$22 to confirm a more durable recovery. Continued strength toward that zone would align WULF with the moves in CIFR and RIOT; a stall below it would suggest today's gain is more of a relief bounce.
Riot Platforms, Inc. (NASDAQ: RIOT) — Sharp Reversal Back Above Both EMAs
Key Highlights
- RIOT trading at $23.86, up 2.05% ($0.48) on volume of 21.22M shares, after ranging between $23.30 and $25.17 on an open at $23.36.
- Price has moved back above both the 20-day EMA ($22.39) and the 50-day EMA ($22.88), reversing a sharp multi-week decline.
- RSI has jumped to roughly 54.39, with the signal line at 36.94 — one of the sharpest RSI accelerations in the group.
- RIOT rallied from an April 2026 low near $14 to a June 2026 high near $30, then fell sharply through July into a low near $18 before today's strong bounce.
- Today's session marks the first close back above both EMAs since the July decline began.
Trend Structure RIOT's chart shows a strong advance from an April 2026 low into a June 2026 peak, followed by a sharp correction into a July low near $18. Today's rally reverses that slide, pushing price back above both moving averages in a single session. 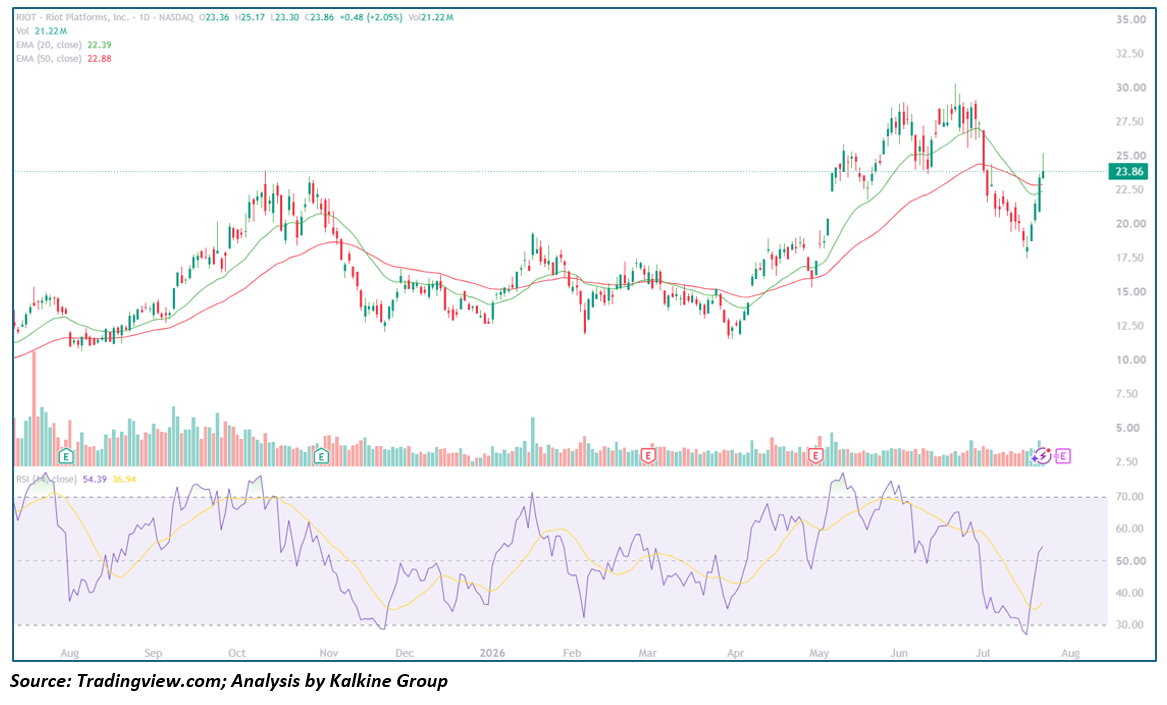
Key Technical Levels Resistance
- ~$25.00 – Today's intraday high area
- ~$30.00 – June 2026 cycle high Support
- $22.88 – 50-day EMA
- $22.39 – 20-day EMA
- ~$18.00 – July 2026 low
Outlook RIOT's sharp reversal, along with the accelerating RSI, is a constructive signal after a steep July decline. Holding above the $22–$23 EMA cluster would support a retest of higher levels; a slip back below it would suggest today's bounce needs more confirmation.
Bitdeer Technologies Group (NASDAQ: BTDR) — Smallest Move in the Group, Still Below Both EMAs
Key Highlights
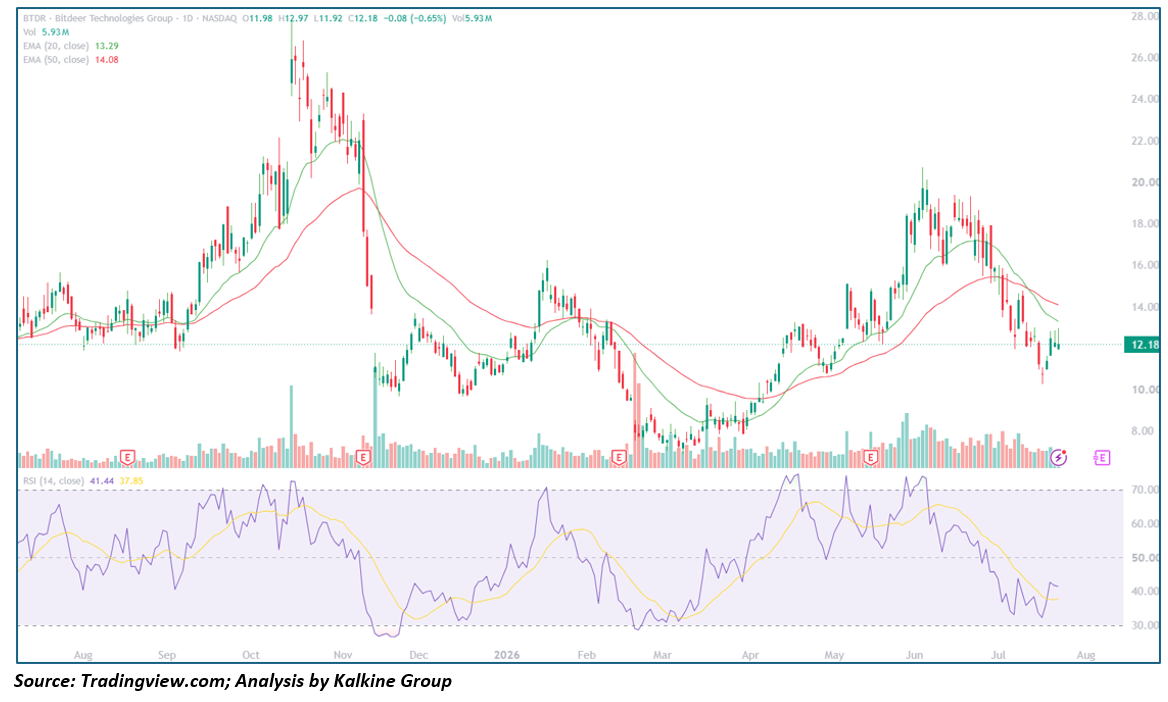
- BTDR trading at $12.18, down 0.65% ($0.08) on volume of 5.93M shares, after ranging between $11.92 and $12.97 on an open at $11.98.
- Price remains below both the 20-day EMA ($13.29) and the 50-day EMA ($14.08).
- RSI sits at roughly 41.44, with the signal line at 37.85 — RSI has crossed modestly above its signal line despite the small decline in price.
- BTDR has been volatile over the past year, swinging from an October 2025 high near $27 to a November 2025 low near $9.50, a spring rally to an April 2026 high near $20, and a decline back to a July 2026 low near $10.80.
- Today's move is the smallest percentage change among the six names covered.
Trend Structure BTDR's chart shows a volatile, range-bound pattern over the past year, with the stock currently attempting to stabilize after a decline from its April 2026 high. Today's session as largely flat, leaving price below both EMAs.
Key Technical Levels Resistance
- $13.29 – 20-day EMA
- $14.08 – 50-day EMA
- ~$16.00 – Prior consolidation zone Support
- ~$11.00 – Recent pullback zone
- ~$10.80 – July 2026 low
Outlook BTDR's muted move today leaves it the least decisive name in the group. A push back above the EMA cluster near $13–$14 would align it with the bounces seen in the mining peers; continued drift below $11 would keep the stock in a more cautious posture.
This analysis is based on daily chart technical indicators (20/50-day EMAs, RSI-14) and price action as of July 23, 2026, and is intended for informational purposes only — not investment advice.


 Nov 17, 2026





 Please wait processing your request...