_05_19_2026_00_12_28_725473.jpg)
A 30% single-session surge, a historic Volume detonation of 102M shares, and a clean Fibonacci extension breakout — HIVE is signalling a potential trend Reversal that demands immediate attention
Key Highlights
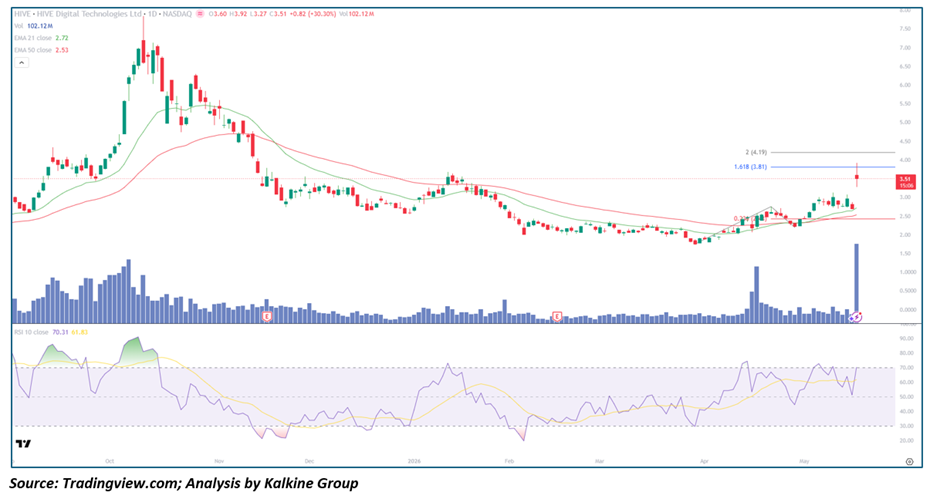
- HIVE Digital Technologies Ltd. (Nasdaq: HIVE) is trading at $3.51, up +$0.82 (+30.30%), in one of the most explosive single-session moves in the stock's recent history
- Volume at an extraordinary 102.12M — a near-unprecedented participation event that dwarfs every other session visible on the chart and signals a major catalyst-driven institutional and retail inflection
- EMA-21 ($2.72) and EMA-50 ($2.53) have recently converged and crossed bullishly — and today's surge has launched price 29% above the EMA-21, marking a decisive trend acceleration
- Fibonacci Extension levels are now in play — the 1.618 extension at $3.81 is the immediate upside target, with the 2.0 extension at $4.19 as the next major bull case milestone
- RSI-10 at 70.31 — crossing into overbought territory with signal at 61.83, confirming powerful momentum while flagging potential near-term consolidation at Fibonacci resistance
- The stock has broken above the critical $3.50–$3.60 horizontal resistance zone that contained price for months — a technically significant level now being tested as support
Trend Structure: A Long Base Finally Breaks — Volume Confirms the Conviction
HIVE Digital's chart tells a story of prolonged distribution, painful consolidation, and now — potentially — a decisive reversal ignited by an extraordinary volume event.
From the August–September 2025 peak near $7.50, HIVE entered one of the most punishing downtrends visible on the chart — a relentless decline from peak to trough that saw the stock shed nearly 70% of its value over six months. The descent was orderly in the worst possible way — systematic institutional distribution characterised by declining EMAs, failing rallies, and a progressively lower series of highs that offered bears no meaningful technical risk.
The low near $2.00 in January–February 2026 marked the first genuine sign of seller exhaustion — a prolonged floor formation between $2.00 and $2.60 where the EMA-21 and EMA-50 gradually converged, flattened, and then — crucially — crossed bullishly in April 2026. This EMA golden cross, modest in isolation, was the first technical signal that the distribution phase was giving way to accumulation.
What followed was a quiet but persistent grind higher through March and April — higher lows being established, the EMAs beginning to slope upward, and RSI building a constructive base above 50. The structure was improving, but the catalyst had not yet arrived.
Today, it arrived. The 102.12M volume session — more than 5–10x the typical daily baseline — represents one of the most significant participation events in HIVE's listed history. When a stock that has been quietly basing for months suddenly erupts on record volume, the technical interpretation is unambiguous: something has fundamentally changed, and large pools of Capital are repositioning simultaneously.
The Fibonacci Extension Framework: Precise Targets for the Next Move
The Fibonacci extension tool applied to the chart provides a structured roadmap for the recovery move, anchored to the prior swing high, the base low, and the current breakout point.
The 1.618 Extension — $3.81 (Immediate Target) The 1.618 Fibonacci extension level at $3.81 represents the first major upside target and the level where the initial wave of momentum buying is most likely to encounter meaningful resistance. Today's intraday high of $3.92 has already briefly pierced this level — a bullish sign confirming the market's near-term ambition — before pulling back to close at $3.51. A sustained daily close above $3.81 would be a powerful confirmation signal for continuation toward the next extension level.
The 2.0 Extension — $4.19 (Medium-Term Bull Case) The 2.0 extension at $4.19 represents the medium-term target for bulls if the $3.81 level is cleared and held. This zone also aligns with a prior consolidation region from October–November 2025, where overhead Supply from previous holders will need to be absorbed. A move to $4.19 from current levels represents approximately 19% additional upside and would bring HIVE back into territory last visited in late 2025.
Beyond $4.19 — Reclaiming the Prior Range Should HIVE sustain momentum and fundamental catalysts continue to support the narrative, the $5.00–$5.50 zone from the October–November 2025 consolidation becomes the extended bull case — a level that would require a complete reversal of the prior downtrend's narrative and sustained evidence of operational and Bitcoin price support.
The Catalysts: What Is Driving Today's Historic Volume Event
Bitcoin and Crypto Sector Momentum As a pure-play Bitcoin miner with GPU computing capabilities, HIVE's fortunes are directly correlated with Bitcoin price action and broader crypto sector sentiment. Any positive BTC price development — including the ongoing institutional adoption narrative — provides a direct fundamental tailwind that amplifies the technical setup.
GPU and AI Infrastructure Pivot HIVE has been strategically repositioning its GPU Mining infrastructure toward high-performance computing and AI workloads — a transition that mirrors the broader pivot seen across the mining sector as companies seek to diversify Revenue beyond Bitcoin's cyclical Volatility. Any positive update on AI HPC revenue contribution would be a significant re-rating catalyst.
Earnings Event Proximity The earnings marker (E) visible at the right edge of the chart coincides precisely with today's volume explosion — strongly suggesting that a fundamental announcement, earnings beat, or material corporate development has served as the ignition point for the move. Earnings-driven gaps of this magnitude on record volume are among the highest-conviction technical signals in the playbook.
Short Covering Dynamics Given HIVE's extended period of underperformance and the prior downtrend, short interest was likely elevated heading into today's session. A positive catalyst on record volume creates a reflexive short-squeeze dynamic — shorts forced to cover into a stock with genuine buying Demand creates the velocity and scale of move visible on the chart today.
Sector Re-Rating The broader Crypto Mining sector has been experiencing a fundamental re-rating as Bitcoin's post-halving supply dynamics, institutional ETF flows, and the AI/HPC pivot narrative converge simultaneously — a sector-wide tailwind that lifts all credible operators, with HIVE positioned to benefit given its dual Bitcoin Mining and GPU computing exposure.
Moving Averages: Bullish Cross Confirmed, Breakout Acceleration Underway
- EMA-21 ($2.72) — recently crossed above the EMA-50 in a bullish golden cross configuration; today's surge has launched price dramatically above this level, confirming the trend change is accelerating
- EMA-50 ($2.53) — rising from a flattened base, providing the deeper structural support floor as the trend develops
The EMA golden cross that occurred in April — where the EMA-21 crossed above the EMA-50 for the first time since the September 2025 peak — was the foundational technical signal that the trend had changed. Today's breakout is the momentum confirmation of that structural shift. In a healthy continuation, pullbacks toward the EMA-21 in the $2.72–$3.00 zone would represent the highest-quality re-entry opportunities — though the magnitude of today's move means such a pullback would require patience to materialise.
Momentum &Amp; Volume: A Once-in-Cycle Volume Event
The RSI-10 at 70.31 — with signal at 61.83 and the RSI line crossing above its signal — has just entered overbought territory for the first time since the September 2025 peak. The last time HIVE's RSI reached this level, it coincided with the prior cycle high near $7.50 — but critically, that reading occurred after a prolonged uptrend, while the current reading is occurring at the very beginning of what may be a new trend. This distinction matters: overbought RSI at the start of a new trend behaves very differently from overbought RSI at the exhaustion of a mature trend.
Volume at 102.12M is the defining feature of today's session and cannot be overstated. This single-day volume figure likely exceeds the combined volume of the prior two to three weeks of trading — it represents a complete market structure event, not a routine momentum session. The previous notable volume spike visible in the chart (the elevated bar in late February 2026) occurred at the lows and likely marked Capitulation; today's spike at a breakout high marks the opposite — accumulation at the beginning of a new phase.
Key Technical Levels and Scenarios
Resistance Levels
- $3.81 — Fibonacci 1.618 extension — immediate target and first major resistance
- $3.92 — Today's intraday high — near-term ceiling to reclaim
- $4.19 — Fibonacci 2.0 extension — medium-term bull case target
- $5.00–$5.50 — Prior October–November 2025 consolidation zone — extended upside
Support Levels
- $3.50–$3.60 — Today's breakout zone — critical support on any near-term pullback
- $2.72 — EMA-21 — key dynamic support for trend continuation
- $2.53 — EMA-50 — major structural support
- $2.00–$2.10 — Base low — ultimate stop reference and trend invalidation level
Scenarios
- Fibonacci Extension Continuation (Primary Case) Price consolidates above the $3.50–$3.60 breakout zone over the next 1–3 sessions, then re-attacks the 1.618 Fibonacci level at $3.81. A sustained close above $3.81 opens the path toward the 2.0 extension at $4.19, driven by continued crypto sector momentum and institutional follow-through from today's historic volume session.
- Healthy Consolidation at Breakout Zone (Secondary Case) The 30% single-session move triggers profit-taking from short-term traders, pulling HIVE back toward the $3.00–$3.20 zone for 3–7 sessions. Volume normalises, RSI cools toward 55–60, and the stock builds a tight consolidation base above the EMA-21 before the next leg higher. This would be an optimal setup for a high-conviction continuation trade with well-defined risk.
- Gap Fill and EMA-21 Test (Risk Case) A broader crypto market reversal or sector-specific negative catalyst triggers a more aggressive pullback toward the EMA-21 at $2.72 — filling a portion of today's gap and retesting the breakout zone from below. While uncomfortable, this level has proven reliable support since the golden cross and would represent a high-conviction accumulation zone for medium-term investors provided the fundamental catalyst remains intact.
The Bear Case: Single-Session Explosions Carry Their Own Risks
The magnitude and velocity of today's move demands honest risk acknowledgment:
- 30% single-session moves on extreme volume are notoriously difficult to sustain — the same retail and momentum participation that drove the spike can reverse equally quickly if the catalyst fails to translate into sustained fundamental improvement
- RSI entering overbought territory on the very first day of a potential new trend means there is limited technical momentum buffer if selling pressure emerges at the Fibonacci resistance levels
- HIVE remains a high-Beta Bitcoin proxy — any BTC price weakness would disproportionately impact the stock, and the correlation between HIVE and crypto sentiment remains the primary systemic risk
- The prior downtrend from $7.50 to $2.00 created substantial overhead supply that will need to be absorbed at each successive resistance level — this is not a clean breakout into all-time highs, but a recovery into a zone of prior distribution
- Fundamental validation required — today's move demands confirmation in subsequent sessions; a high-volume reversal back below $3.00 within 2–3 days would negate the bullish interpretation and signal a false breakout
Conclusion: Historic Volume Breaks the Fibonacci Ceiling — The Next 48 Hours Are Critical
HIVE Digital Technologies has delivered one of the most technically significant single sessions in its recent history — a 30% surge on 102M shares that has simultaneously broken above a major horizontal resistance zone, pierced the 1.618 Fibonacci extension, and confirmed the EMA golden cross that was quietly forming over the prior two months.
The Fibonacci extension framework provides clear, actionable targets: $3.81 as the immediate milestone, $4.19 as the medium-term bull case, and $5.00–$5.50 as the extended target if the fundamental catalyst driving today's move proves durable. The EMA-21 at $2.72 and the breakout zone at $3.50–$3.60 define the risk parameters with equal clarity.
The next 48–72 hours will determine whether today represents the beginning of a sustained new uptrend or a one-day wonder driven by short-term dynamics. The key questions: Does volume remain elevated in subsequent sessions? Does price hold above the $3.50–$3.60 breakout zone? And does the fundamental catalyst — whatever triggered today's 102M volume event — prove to be a genuine re-rating driver or a transient spike?
For traders, the setup demands respect for both the opportunity and the risk. A close above $3.81 on continued elevated volume is the high-conviction continuation signal. For investors, any consolidation that holds above the EMA-21 over the coming days validates the structural case for accumulation with the February lows as the ultimate risk reference.
HIVE has awakened. Whether this is the beginning of the next cycle or a false dawn will become clear quickly — and the chart will tell you before the news does.


 Please wait processing your request...