
 CA
 NZ
 UK
 AU
 IND

 US

 Share
 X (Formerly Twitter)
 Whatsapp
 Facebook
 LinkedIn
 Telegram
 Email This Article
 Copy Link
 Summarize with AI
 Chat GPT
 Perplexity

Key Highlights
- Ichor Holdings (Nasdaq: ICHR) closed at $67.99, gaining +4.09% in a strong recovery session
- Price traded between $66.03 and $69.25 intraday, reflecting confident buying off the lows
- The stock is holding above the EMA-21 ($67.80) and well above the EMA-50 ($61.13), confirming bullish trend alignment
- RSI-10 at 49.69 has reset from overbought territory back to neutral, with the signal line at 57.21 acting as near-term resistance
- Volume at 281.12K was healthy, consistent with Demand-driven buying rather than short-covering
- The stock has delivered a remarkable multi-month advance from the December lows near $15, gaining over 350% to recent highs near $77
- Current price action suggests a healthy pullback-and-hold within a dominant uptrend rather than any structural deterioration
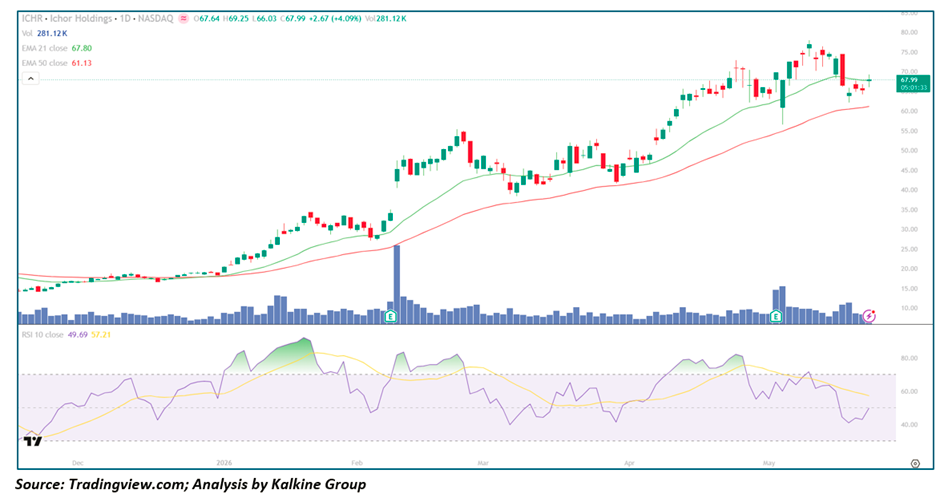
Trend Structure: From Dormant Base to High-Momentum Leadership
Phase 1 — Extended Base & Quiet Accumulation (Oct – Dec 2025)
ICHR spent the final quarter of 2025 in a prolonged low-Volatility base near the $15–$18 region, characterised by:
- Minimal price movement and compressed trading ranges
- Both EMAs flat and tightly wound — a classic coiling pattern
- Volume subdued with no directional conviction
- Silent accumulation evident in the gradual stabilisation of price
This extended period of dormancy created the energy compression that ultimately powered the explosive breakout.
Phase 2 — Initial Breakout & Momentum Ignition (Jan – Feb 2026)
ICHR broke decisively from its base with force:
- Price surged from $18 to the $45–$50 range in a matter of weeks
- An extraordinary volume spike confirmed the presence of institutional buying at the breakout point
- Both EMAs began rising sharply with price pulling well clear above them
- RSI entered and sustained overbought territory — a hallmark of genuine momentum leadership
- Higher highs and higher lows became the consistent pattern
The speed and magnitude of the initial move signalled that this was a fundamentally driven re-rating, not merely a speculative pop.
Phase 3 — Consolidation, Re-Acceleration & New Highs (Mar – May 2026)
Following the initial surge, ICHR demonstrated impressive trend resilience:
- A healthy mid-February pullback to the $40 zone was met with strong buying
- Price re-accelerated through March and April, making new highs above $75
- A second elevated-volume event in late April coincided with another powerful advance
- The recent pullback from $77 to the $64–$65 zone has been orderly and measured
- Today's 4.09% recovery candle, closing back above the EMA-21, is a constructive signal that the pullback is finding its natural floor
Moving Averages: Powerfully Bullish Structure Remains Intact
EMA-21 ($67.80)
- Price closed fractionally above this level today — a critical reclaim
- Rising sharply, reflecting the velocity of the broader uptrend
- Has consistently acted as dynamic support during prior pullbacks throughout the advance
- A sustained hold above $67.80 would confirm the consolidation phase is complete
EMA-50 ($61.13)
- Trending strongly higher after months of recovery
- Sits approximately 10% below current price — reflecting the strength of the prevailing trend
- Represents the ultimate bull/bear line for the medium-term thesis
- Any pullback toward this level would represent a high-conviction re-entry opportunity
The widening gap between the two rising EMAs confirms the trend is not merely intact — it is strengthening.
Momentum Analysis: RSI Reset Offers a Fresh Entry Window
RSI-10 at 49.69 has undergone a meaningful and healthy reset from the overbought readings above 80 seen during the April peak.
Current RSI behaviour suggests:
- Momentum has unwound to neutral without approaching oversold — a hallmark of Bull Market corrections
- The RSI signal line at 57.21 sits above the RSI itself, indicating near-term caution but not trend breakdown
- A bullish RSI crossover above the 57 signal line from these levels would be a reliable re-entry trigger
- Each prior RSI reset to the 45–50 zone in this chart has been followed by a resumption of the uptrend
The pattern of higher RSI lows over the course of the advance further reinforces the underlying momentum structure.
Volume Analysis: Institutional Footprint Remains Visible
Volume behaviour throughout ICHR's advance has been a consistent source of confidence for bulls.
Key observations include:
- Two major institutional-scale volume spikes have aligned precisely with the most powerful breakout moments
- Recent pullback sessions have occurred on below-average volume — no signs of aggressive distribution
- Today's recovery session volume of 281.12K is respectable and consistent with genuine buying interest
- The overall pattern of elevated volume on advances and subdued volume on declines is the textbook signature of an institutionally supported uptrend
Key Technical Levels
Resistance Levels
- $69–$70 — immediate overhead resistance and recent consolidation ceiling
- $73–$75 — prior high zone from late April
- $77–$78 — all-time high region and primary breakout target
Support Levels
- $67–$68 — EMA-21 and current price support
- $64–$65 — recent consolidation floor
- EMA-50 at $61.13 — primary dynamic support
- $50–$52 — major structural support from the March consolidation zone
Scenario Analysis
- Bullish Continuation (Primary Case)
If ICHR sustains above the EMA-21 ($67.80): → Momentum could re-accelerate toward the $73–$75 prior high zone → A RSI crossover above 57 would confirm renewed bullish momentum → Semiconductor equipment cycle tailwinds could sustain institutional inflows
- Extended Consolidation (Healthy Outcome)
Price may range between $65–$70 for several sessions: → RSI rebuilds gradually from the high-40s → EMA-21 catches up and provides a tighter support platform → Compression at these levels would set up a powerful breakout toward new highs
- Bearish Reversal (Risk Case)
A failure below the EMA-21 and subsequent break of $64 on heavy volume would raise caution flags: → First downside target near EMA-50 at $61.13 → Trend thesis would weaken materially on a close below $60 → Given the strength of the broader advance, this remains a low-probability scenario
Conclusion: ICHR Remains One of the Strongest Charts in the Semiconductor Equipment Space
Ichor Holdings has been an exceptional momentum performer over the past six months, delivering a near-400% advance from its December base — and critically, the current pullback shows none of the distribution characteristics that typically precede genuine trend reversals. Today's recovery above the EMA-21 on solid volume, combined with an RSI that has reset cleanly to neutral, sets up a compelling risk/reward re-entry for both momentum traders and growth investors.
The framework moving forward is clear:
- Above EMA-21 at $67.80 → bullish momentum intact, target $73–$75
- Above $77–$78 → all-time high breakout, trend acceleration likely
- Below EMA-50 at $61.13 → near-term caution warranted, thesis under review
For investors seeking exposure to the semiconductor equipment cycle, ICHR continues to exhibit the hallmarks of institutional-quality momentum leadership — and today's price action suggests the bulls have no intention of surrendering this trend without a fight.


 Nov 19, 2026





 Please wait processing your request...