
A +10.67% explosion on Earnings Volume, a decisive reclaim above both EMAs, and a year-long uptrend accelerating — LSCC is sending one of the clearest bullish signals in the semiconductor space.
Key Highlights
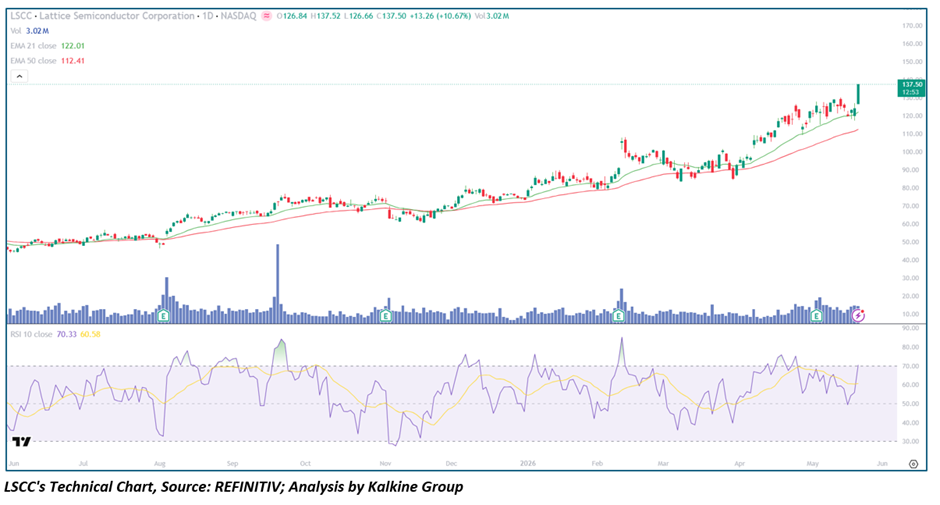
- LSCC closed at $137.50, surging +$13.26 (+10.67%) — a powerful single-session breakout candle
- Intraday range: $126.66 – $137.52, closing right at the highs — maximum bullish conviction
- EMA 21 (~$122.01) and EMA 50 (~$112.41) both rising steeply, with price now $15+ above EMA 21 — a strong bullish separation
- RSI 10 at 70.33, crossing above signal line at 60.58 — entering overbought territory on momentum surge
- Volume at 3.02M — significantly above average, with an earnings event marker (E) confirming catalyst-driven institutional buying
- Chart spans June 2025 to May 2026 — capturing a full intermediate bull cycle
Trend Structure: A Staircase Uptrend That Just Shifted Into a Higher Gear
LSCC's Daily Chart tells the story of a stock in a relentless, methodical uptrend since its June 2025 lows near $40 — tripling in value over roughly 12 months through a series of clean impulse moves and orderly consolidations. Each leg higher has been defined by the same pattern: price advances, pulls back to test the EMA 21 or EMA 50, finds support, and launches into the next impulsive move — a hallmark of genuine institutional accumulation across multiple quarters. The February–April 2026 consolidation between ~$85–$100 was the longest pause of the cycle, but rather than breaking down, it formed a textbook higher low base that has now launched into what may be the most powerful leg of the entire advance. Today's +10.67% earnings-driven surge, closing at the absolute high of the day at $137.50 on 3.02M volume, is the kind of breakout candle that historically marks the beginning of an extended new leg — not the end of one.
The Critical Confluence Zone: $120–$125
With today's explosive move, LSCC has vaulted well above its key technical levels, creating a new support cluster that bulls will defend aggressively:
- EMA 21 (~$122.01):Now $15 below current price and rising — will continue to climb toward price over coming sessions, eventually providing dynamic support on any pullback.
- Prior Resistance Turned Support (~$120–$125):The April–May consolidation highs that capped multiple rally attempts have now been decisively broken and converted into support — a classic breakout-and-retest setup in the making.
- EMA 50 (~$112.41):Trending higher and providing a deep structural floor nearly $25 below current price — confirming the longer-term bull trend has ample cushion beneath it.
The combination of these levels creates a well-defined support band that any healthy pullback should respect, offering optimal re-entry zones for those who missed today's surge.
Moving Averages: Bullish Alignment at Its Most Aggressive
- EMA 21 (~$122.01) — rising sharply, acting as primary dynamic support
- EMA 50 (~$112.41) — trending higher, well below price, structural bull trend anchor
- Price above both EMAs by significant Margin — signals strong momentum and trend acceleration
- EMA spread expanding — the widening gap between EMA 21 and EMA 50 reflects accelerating institutional momentum, not distribution
The EMA configuration on LSCC is as clean and bullish as it gets — both averages rising in parallel with price well above both, a setup that historically precedes further upside rather than immediate Reversal.
Momentum: RSI Breakout Into Overbought — The Right Kind
The RSI 10 at 70.33 has broken decisively above its signal line at 60.58 and crossed into overbought territory — but critically, this is the right kind of overbought reading. Throughout LSCC's entire uptrend, RSI spikes into the 70–80+ zone have consistently marked the beginning of powerful new legs rather than exhaustion tops, with the stock repeatedly consolidating briefly before pushing even higher. The RSI signal line at 60.58 has acted as a reliable bull/bear momentum divider throughout the chart — every sustained rally has kept RSI above this level, while every meaningful correction has seen it dip below. Today's decisive cross above 60.58 with strong volume confirms a momentum regime shift back to fully bullish.
Key RSI levels to watch:
- RSI > 70 (current) → momentum breakout confirmed; trend acceleration phase
- RSI sustaining 65–75 → ideal bull continuation zone
- RSI rejection back below 60 → short-term caution; potential consolidation
- RSI < 50 → would signal meaningful correction; reassess thesis
Key Technical Levels and Scenarios
Resistance Levels
- $137.52 — today's intraday high; immediate short-term ceiling
- $145–$150 — psychological resistance and measured move target
- $155–$160 — next major Supply zone
- $170+ — macro breakout extension target
Support Levels
- $130–$132 — post-breakout consolidation zone (nearest)
- $122.01 — EMA 21 (primary dynamic support)
- $115–$118 — prior consolidation base
- $112.41 — EMA 50 (key structural support)
- $100–$105 — deep correction support / cycle low zone
Scenario Analysis
- Bullish Continuation (Primary Case)Price consolidates briefly between $130–$138, digests the earnings gap, then pushes toward $145–$150. RSI remains above 65, EMA 21 continues rising. → Near-term target: $145–$150 | Extended target: $160–$170
- Healthy Pullback and Re-acceleration (Base Case)Post-earnings drift back toward $122–$125 EMA 21 zone on reduced volume — a textbook gap Fill and retest. Bulls step in aggressively at the EMA. → Optimal re-entry zone; next leg launches toward $150+
- Bearish Gap Fill (Risk Case)Failure to hold above $122 EMA 21 on a closing basis, with RSI collapsing back below 55 and volume drying up. → Retest of $112 EMA 50→ Below $105 = near-term bull thesis invalidated
The Bear Case: Risks to Monitor
- Post-earnings "sell the news" dynamic — today's gap could partially fill in coming sessions
- Semiconductor sector-wide weakness from export controls or macro headwinds
- RSI entering extended overbought territory increases short-term vulnerability
- Any guidance disappointment in subsequent management commentary
- Broader Nasdaq correction pulling high-Beta semis lower
Despite an exceptionally strong chart, the sheer magnitude of today's single-session move (+10.67%) means short-term traders should respect the possibility of a brief consolidation or partial Retracement before continuation.
Conclusion: A Breakout That Demands Attention
Lattice Semiconductor has delivered exactly the kind of technically and fundamentally confluent breakout that defines generational momentum stocks — a +10.67% earnings surge, closing at the absolute high of the day, on more than 3x average volume, with both EMAs rising and price in a year-long structural uptrend. The framework is unambiguous:
- Hold above $130 → immediate breakout continuation; target $145–$150
- Pullback to $122 EMA 21 → high-value accumulation zone; bull thesis intact
- Close below $112 EMA 50 → warning signal; reduce exposure
- Below $100 → near-term cycle invalidation
This is not a random spike — it is a technically validated, institutionally driven breakout in a fundamentally sound semiconductor Franchise. For investors, any pullback to the rising EMA 21 represents a compelling Risk-adjusted entry. For traders, the momentum is unequivocally bullish as long as the EMAs hold.


 Please wait processing your request...