
 CA
 NZ
 UK
 AU
 IND

 US

 Share
 X (Formerly Twitter)
 Whatsapp
 Facebook
 LinkedIn
 Telegram
 Email This Article
 Copy Link
 Summarize with AI
 Chat GPT
 Perplexity

Today's session produced a sweeping rally across mega-cap technology and semiconductor names. Dell Technologies (NYSE: DELL) and Microsoft (NASDAQ: MSFT) both surged roughly 9.5%, Semtech (NASDAQ: SMTC) added more than 8%, and Circle Internet Group (NYSE: CRCL), Apple (NASDAQ: AAPL), and Alphabet (NASDAQ: GOOGL) all posted solid gains ranging from roughly 1.5% to nearly 6%. Volume was heavy across the group, with several names breaking decisively above key moving averages after multi-week consolidations or corrections.
Dell Technologies Inc. (NYSE: DELL) — Explosive Breakout Above a Multi-Month Range
Key Highlights
- DELL trading at $469.98, up 9.55% ($40.96) on volume of 6.14M shares, after ranging between $443.83 and $476.90 on an open at $449.28.
- Price has broken decisively above both the 20-day EMA ($417.10) and the 50-day EMA ($385.23), clearing the top of a range that had capped the stock since May.
- RSI has climbed to roughly 61.31, with the signal line at 51.48 — a firm move into bullish territory without yet reaching extreme overbought levels.
- DELL spent late 2025 rangebound in the $130s-$150s before an explosive breakout in March 2026 carried it to the $400s by May; the stock then consolidated in a roughly $380-$450 range through the summer before today's decisive breakout.
- Today's gain is one of the largest single-day moves on the chart since the initial spring breakout.
Trend Structure DELL's chart shows a long, quiet base through late 2025, followed by an explosive uptrend from around $150 in February 2026 to the $400s by May. The stock then spent several months consolidating in a well-defined range before today's session cleared the top of that range on heavy volume. 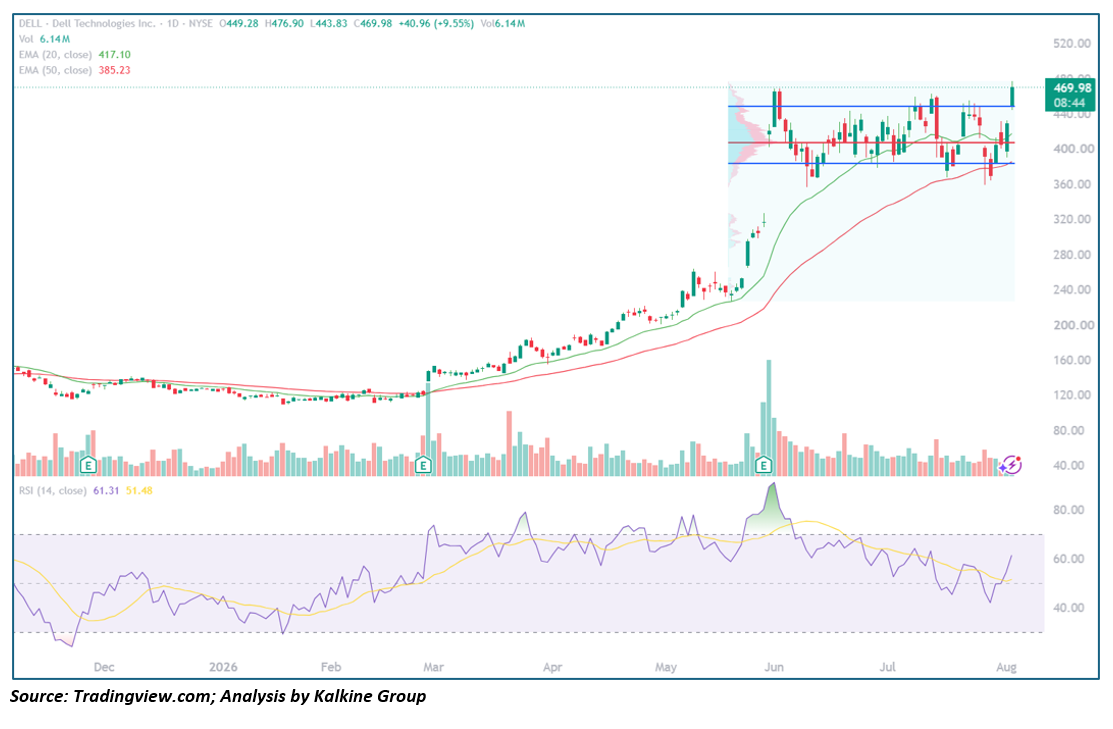
Key Technical Levels
Resistance
- ~$480.00 – Today's intraday high area
- No prior chart resistance overhead; the stock is testing new highs
Support
- $417.10 – 20-day EMA
- ~$440.00 – Top of the recent multi-month range (former resistance, now support)
- $385.23 – 50-day EMA
Outlook DELL's breakout is a decisive technical development, clearing a range that had constrained the stock for months. A hold above $440 on any retest would confirm the breakout has staying power; a fast fade back into the prior range would suggest today's move needs more time to be digested.
Microsoft Corp. (NASDAQ: MSFT) — Explosive Two-Day Gap, Deeply Overbought After Reclaiming the Range
Key Highlights
- MSFT trading at $495.14, up 1.54% ($7.49) on volume of 35.59M shares, after ranging between $479.17 and $499.44 on an open at $480.90.
- Price has surged well above both the 20-day EMA ($418.40) and the 50-day EMA ($406.21), following an explosive two-session gap that cleared months of overhead resistance.
- RSI has spiked to roughly 79.35, with the signal line at 57.96 — a sharp move into deeply overbought territory.
- MSFT declined from a late-2025 high near $500 into a March 2026 low near $345, then chopped in a wide range through the spring and summer, spiking to a June high near $460 before pulling back to the $350s in July; today's session extends a powerful two-day surge to fresh highs for the year.
- Today's gain caps a two-day move that is by far the sharpest on the chart.
Trend Structure MSFT's chart shows a steady decline from a late-2025 peak into a March 2026 low, followed by a volatile, range-bound recovery attempt through the spring and summer. A sharp bounce off the July low has now carried the stock to fresh highs in an explosive two-session gap. 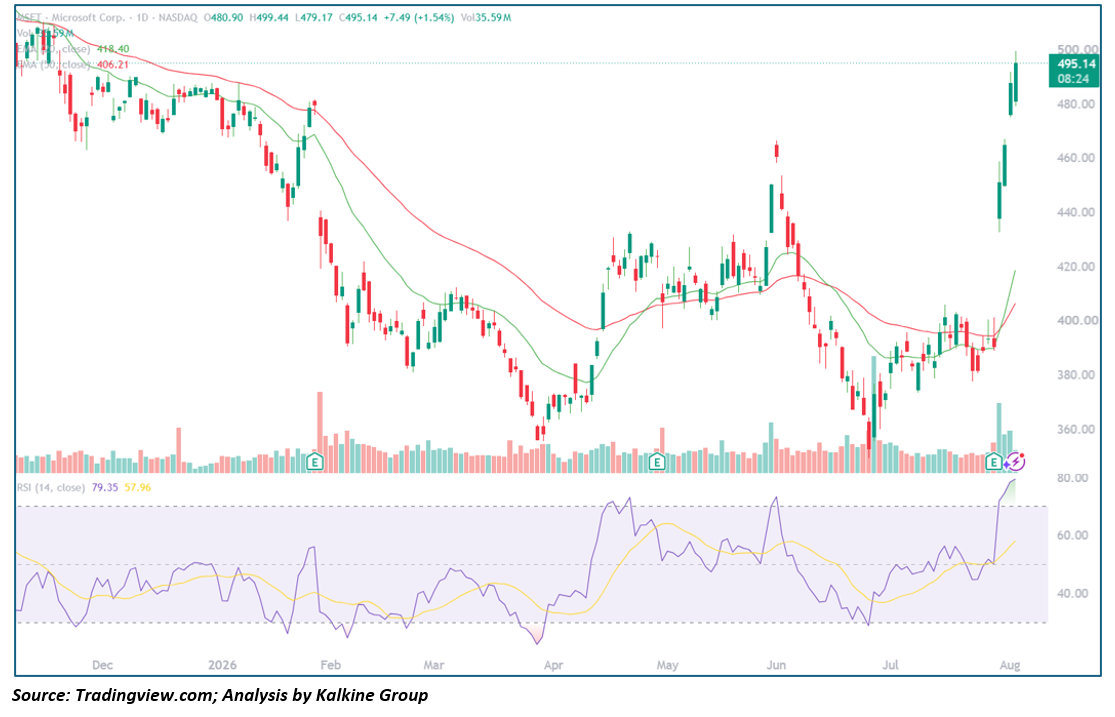
Key Technical Levels
Resistance
- ~$500.00 – Psychological round-number level / late-2025 high
- No prior chart resistance meaningfully overhead beyond that level
Support
- $418.40 – 20-day EMA
- $406.21 – 50-day EMA
- ~$460.00 – June 2026 swing high (former resistance, potential support)
Outlook MSFT's gap is a textbook breakout on heavy volume, but the extreme RSI reading raises the risk of near-term consolidation or a partial pullback. Holding above $460 on any retest would confirm the breakout has staying power; a full round-trip back into the summer range would suggest today's move was an overextension.
Semtech Corporation (NASDAQ: SMTC) — Sharp Bounce Off Multi-Month Lows
Key Highlights
- SMTC trading at $128.97, up 8.31% ($9.89) on volume of 1.66M shares, after ranging between $125.64 and $130.77 on an open at $127.25.
- Price has moved back above the 20-day EMA ($127.49) but remains just below the 50-day EMA ($132.75), which continues to cap the stock from above.
- RSI has climbed to roughly 49.19, with the signal line at 42.58 — a firm move back toward the midpoint after a steep decline.
- SMTC rallied from roughly $55 in March 2026 to a June 2026 high near $180, then corrected sharply into a low near $105 before today's bounce.
- Today's gain is among the largest single-day moves since the stock's spring breakout phase.
Trend Structure SMTC's chart shows a strong uptrend from early 2026 into a June 2026 peak, followed by a steep, sustained decline that erased a significant portion of those gains. Today's session marks a sharp bounce off the recent low, reclaiming the 20-day EMA. 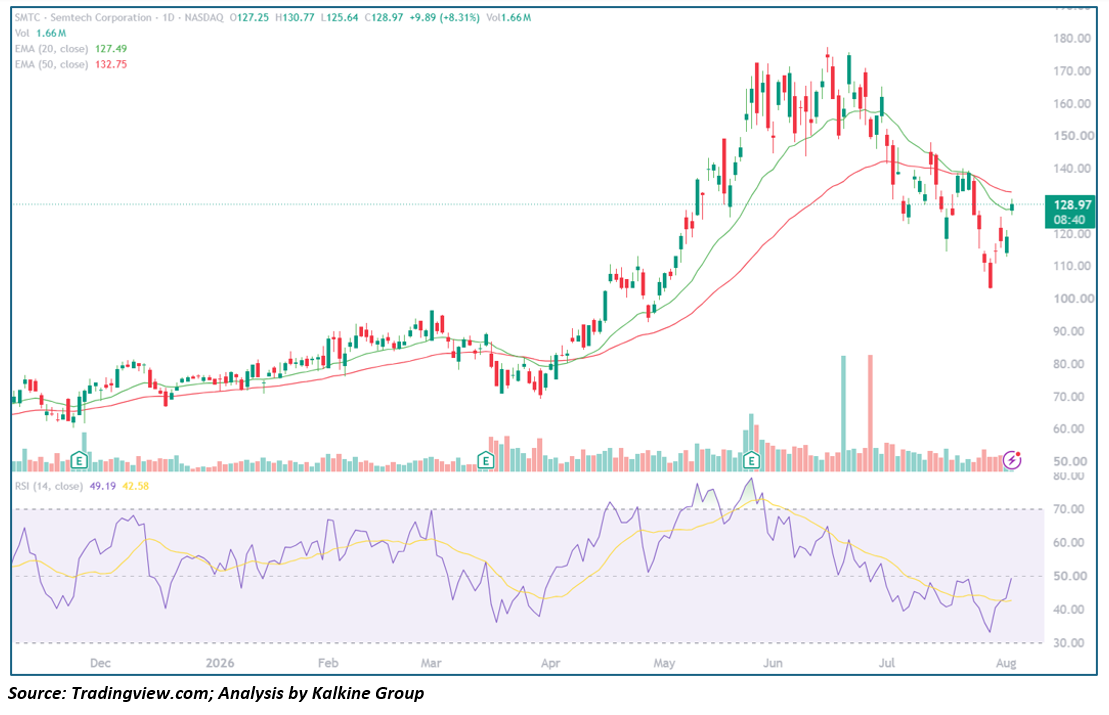
Key Technical Levels
Resistance
- $132.75 – 50-day EMA
- ~$150.00 – June/July 2026 consolidation shelf
Support
- $127.49 – 20-day EMA
- ~$115.00 – Recent basing area
- ~$105.00 – Recent low
Outlook SMTC's bounce is a constructive first step after a punishing decline, though the stock still needs to reclaim the 50-day EMA to fully repair the chart. Holding above $120 on any pullback would support the case for a durable low; a quick fade back toward $105 would keep the downtrend intact.
Circle Internet Group, Inc. (NYSE: CRCL) — Firm Bounce, Still Deep Below Both EMAs
Key Highlights
- CRCL trading at $63.80, up 5.72% ($3.45) on volume of 9.75M shares, after ranging between $60.07 and $64.36 on an open at $60.30.
- Price remains well below both the 20-day EMA ($65.15) and the 50-day EMA ($74.15), despite today's bounce.
- RSI sits at roughly 45.67, with the signal line at 42.53 — a modest recovery that remains below the midpoint.
- CRCL swung from a February 2026 low near $55 to a March high near $140, corrected into an April low near $90, rallied again to a May high near $135, and has since declined steadily into today's session, which marks a bounce off multi-month lows.
- Today's gain offers a modest reprieve after a prolonged, multi-week slide.
Trend Structure CRCL's chart shows a highly volatile year, with two sharp rally-and-correction cycles giving way to a steady, grinding decline since the May 2026 peak. Today's bounce leaves the stock still well below both EMAs. 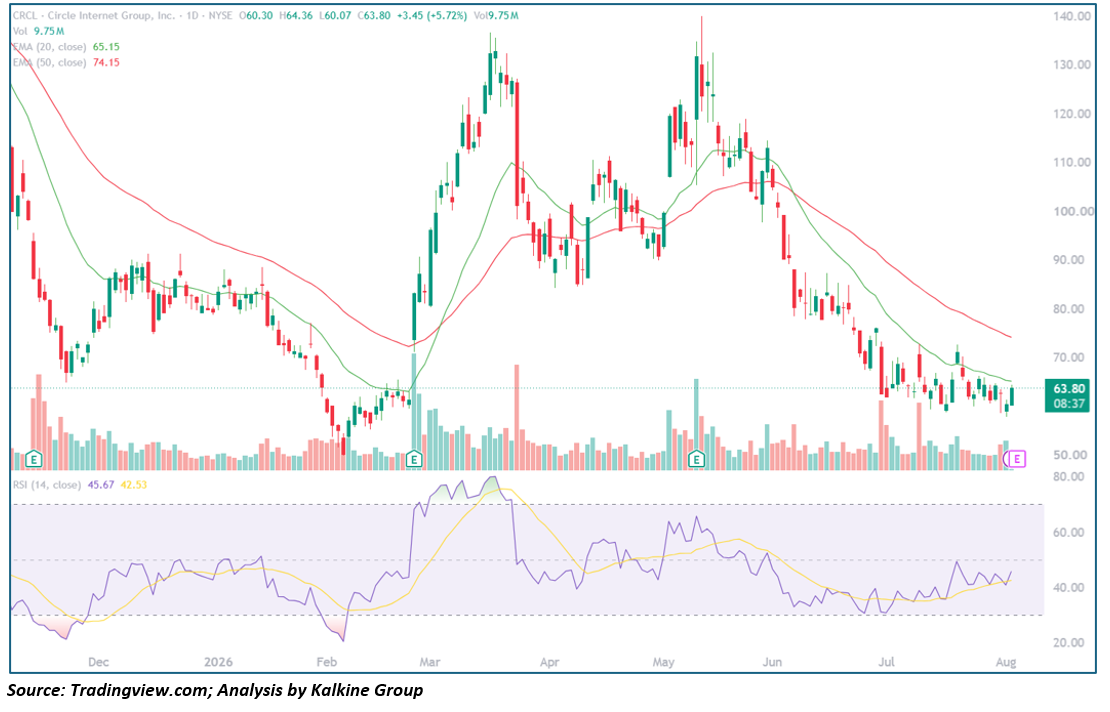
Key Technical Levels
Resistance
- $65.15 – 20-day EMA
- $74.15 – 50-day EMA
Support
- ~$60.00 – Today's intraday low area
- ~$55.00 – February 2026 low
Outlook CRCL's bounce is a modest positive after a difficult stretch, but the stock remains in a clear downtrend with both EMAs well overhead. A reclaim of the 20-day EMA would be the first sign of stabilization; continued weakness below $60 would point to further downside risk.
Apple Inc. (NASDAQ: AAPL) — Solid Gain, but Slipping Back Below the 20-Day EMA After a Strong Run
Key Highlights
- AAPL trading at $309.95, up 2.15% ($6.53) on volume of 43.5M shares, after ranging between $301.32 and $310.42 on an open at $302.73.
- Price has dipped just below the 20-day EMA ($319.78) despite today's gain, though it remains above the 50-day EMA ($309.63).
- RSI sits at roughly 45.07, with the signal line at 60.77 — a cooling-off after a strong overbought run, with the RSI now trading below its signal line.
- AAPL rallied steadily from roughly $245 in April 2026 to a fresh high near $340 in early August, before pulling back over the past few sessions into today's range.
- Today's bounce comes after a sharper two-day pullback from the recent highs.
Trend Structure AAPL's chart shows a long, persistent uptrend from an April 2026 low into an early-August 2026 peak near $340, with only shallow pullbacks along the way. The past several sessions have produced the first meaningful pause in that uptrend, with price slipping back toward the 50-day EMA. 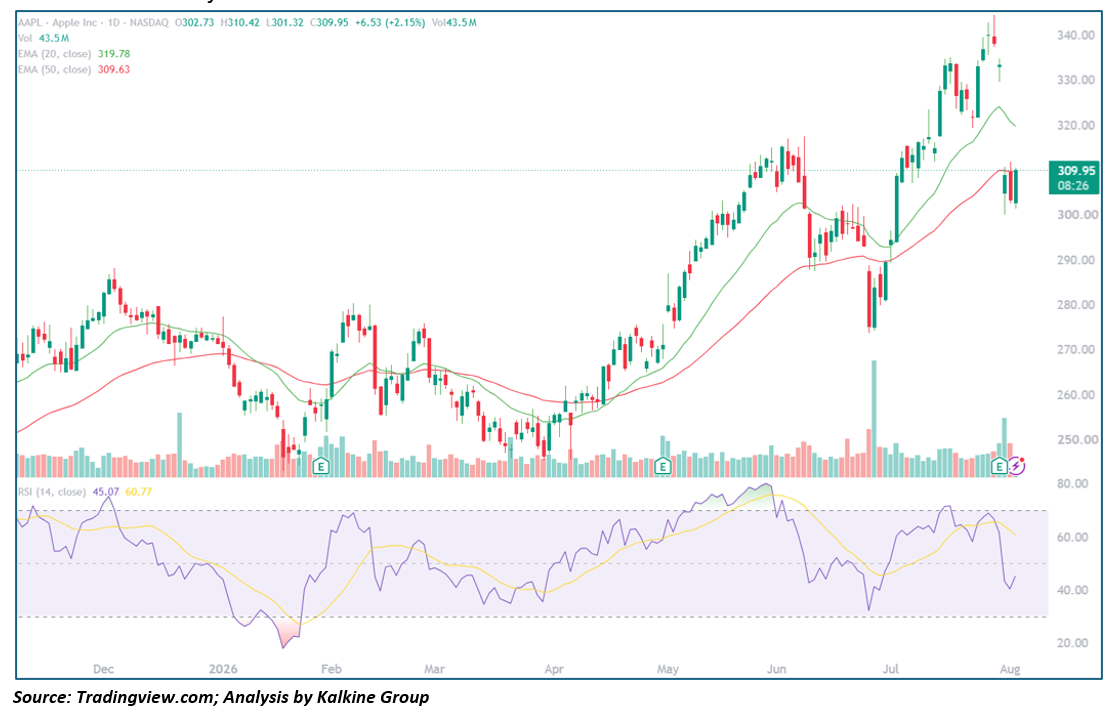
Key Technical Levels
Resistance
- $319.78 – 20-day EMA
- ~$340.00 – Early-August 2026 high
Support
- $309.63 – 50-day EMA
- ~$300.00 – Psychological round-number level
- ~$290.00 – Late-July consolidation area
Outlook AAPL's pullback looks like normal digestion within a strong uptrend so far, and today's bounce keeps the stock above its 50-day EMA. A reclaim of $320 would put the recent highs back in play; a break below $300 would raise questions about the durability of the summer rally.
Alphabet Inc. (NASDAQ: GOOGL) — Breaking Out of a Multi-Month Range on Rising Momentum
Key Highlights
- GOOGL trading at $379.07, up 1.49% ($5.56) on volume of 25.46M shares, after ranging between $367.50 and $380.52 on an open at $368.22.
- Price has broken back above both the 20-day EMA ($350.56) and the 50-day EMA ($353.38), clearing the top of a range that had contained the stock since May.
- RSI has climbed to roughly 63.03, with the signal line at 44.60 — a firm move into bullish territory.
- GOOGL rallied from the low-$200s in late 2025 to a February 2026 high near $355, corrected sharply into an April low near $280, then rallied back to a May high near $400 before spending the summer chopping in a roughly $320-$400 range; today's session pushes back toward the top of that range.
- Today's gain extends a multi-session recovery off the recent range lows.
Trend Structure GOOGL's chart shows a strong uptrend into a February 2026 peak, a sharp corrective decline into April, and a subsequent rally back to a May high. The stock has spent the summer consolidating in a wide range, and today's session breaks back above the EMA cluster toward the top of that range. 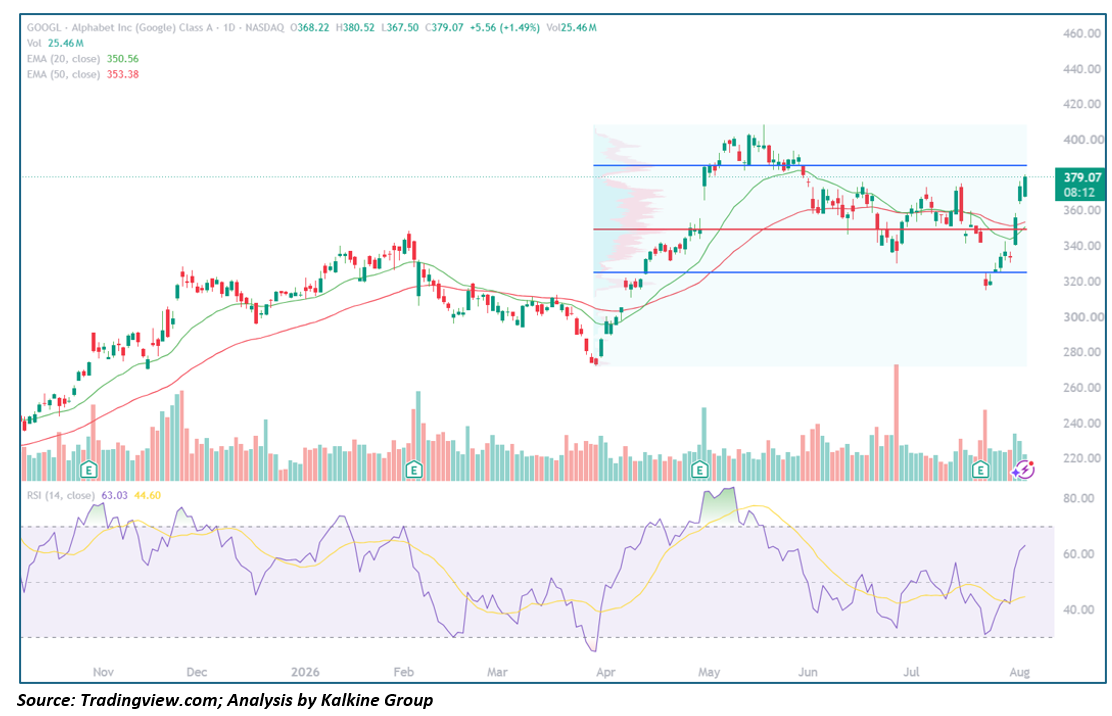
Key Technical Levels
Resistance
- $380.52 – Today's intraday high
- ~$400.00 – May 2026 range high
Support
- $353.38 – 50-day EMA
- $350.56 – 20-day EMA
- ~$320.00 – Recent range low
Outlook GOOGL's breakout keeps the stock working toward the top of its summer range. A close above $380 would open a path toward retesting the May highs near $400; a fade back into the EMA cluster would suggest more consolidation is needed first.
This analysis is based on daily chart technical indicators (20/50-day EMAs, RSI-14) and price action as of August 4, 2026, and is intended for informational purposes only — not investment advice.


 Nov 16, 2026





 Please wait processing your request...