
Key Highlights
• NVIDIA Corporation is trading below its 200-period SMA, indicating weakening long-term trend support.
• The 50-day and 200-day moving averages are nearing a bearish crossover, signaling potential downside risk.
• Price structure shows increasing weakness, with recent declines gaining traction.
• RSI (14) is below the midpoint, reflecting negative momentum.
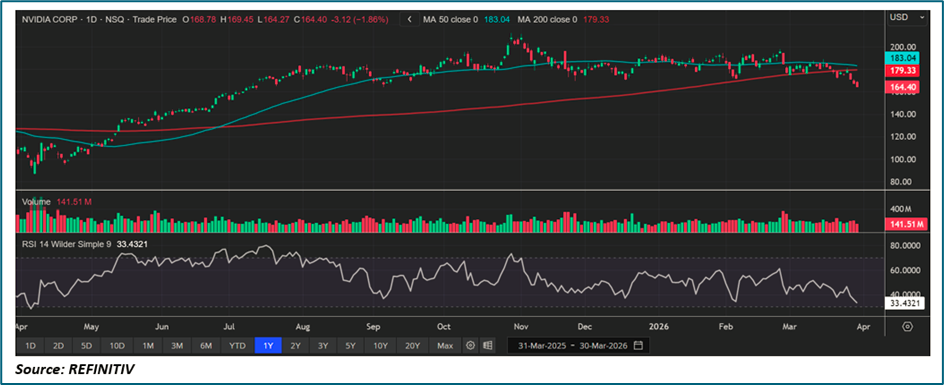
The chart of NVIDIA reflects a weakening technical setup, with price action slipping below key long-term support and momentum indicators tilting bearish. The stock appears to be entering a potentially vulnerable phase following a period of consolidation and gradual deterioration.
Trend Structure: Emerging Weakness Below Key Averages
The dominant feature of the current setup is the breakdown below the 200-day SMA:
• Price has fallen beneath a major long-term trend indicator
• This level often acts as dynamic support in bullish phases
• A sustained move below it signals a potential trend shift
Additionally, the narrowing gap between the 50-day and 200-day SMAs suggests that a bearish crossover may be imminent, reinforcing downside risks.
Price Action: Breakdown Signals Growing Selling Pressure
Recent price behavior highlights increasing bearish control:
• Failure to hold above the 200-day SMA indicates weakening demand
• Lower highs in recent sessions suggest fading buying interest
• Downward drift reflects sustained selling pressure
This places the stock in a technically fragile position, where further downside could materialize if weakness persists.
Moving Average Analysis: Bearish Crossover Risk
The interaction between key moving averages is critical:
• The 50-day SMA is trending lower
• The 200-day SMA is flattening
• A bearish crossover (death cross) appears likely
Such a crossover is often interpreted as a medium-term bearish signal, especially when supported by weak price action.
RSI Momentum: Below Midpoint Reflects Weakness
The Relative Strength Index (RSI 14) is currently below 50:
• Indicates bearish momentum is dominating
• Suggests lack of buying strength
• No immediate signs of reversal
This aligns with the broader negative tone in price action.
Volume Profile: Subdued Participation
Volume trends further confirm the lack of conviction:
• No significant spikes in buying volume
• Selling pressure is steady but not aggressive
• Lack of strong accumulation signals
Low volume during declines can indicate a gradual drift lower rather than panic selling.
Key Technical Scenarios
- Continued Downside Below 200-Day SMA
If weakness persists:
• Price may extend declines further
• Bearish crossover could accelerate downside momentum
• Market sentiment may turn increasingly negative
Confirmation would require sustained trading below the 200-day SMA with rising volume.
- Reclaiming Key Moving Averages
If price recovers:
• A move back above the 200-day SMA could stabilize sentiment
• Short-term relief rally may emerge
• Bearish signals may weaken
This scenario would require improved momentum and stronger buying participation.
Market Structure: Transition Toward Bearish Bias
Overall, NVIDIA appears to be shifting from a consolidation phase toward a more bearish structure:
• Breakdown below long-term support
• Weakening momentum indicators
• Potential moving average crossover
This suggests a transition from neutral to negative market conditions.
Risk Considerations in the Current Setup
Several risks remain relevant:
• False breakdowns below the 200-day SMA are possible
• Low volume may lead to choppy price action
• Broader semiconductor sector trends could influence direction
• Sudden volatility spikes may alter the setup
Conclusion: NVIDIA Shows Early Signs of a Bearish Shift
NVIDIA is currently trading below its 200-day SMA, with momentum indicators and moving averages signaling increasing downside risk. While confirmation of a sustained bearish trend is still developing, the current setup points to a weakening technical outlook.
The behavior of price around the 200-day SMA, along with the potential bearish crossover and momentum trends, will be key in determining whether the stock enters a deeper corrective phase or stabilizes in the near term.


 Please wait processing your request...