
Lidar specialist Ouster (Nasdaq:OUST). rose 26.09% on 13 May 2026, closing the at USD 34.17 with reported Volume nearly three-and-a-half times normal — the largest mid-cap mover among lidar-adjacent names on the day.
Key Highlights
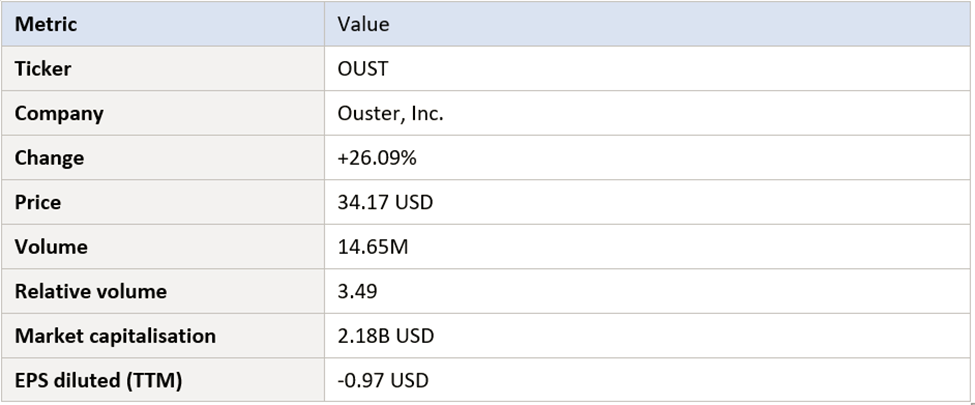
- OUST closed at USD 34.17, up 26.09% on the session.
- Volume of 14.65 million shares ran at 3.49× normal activity.
- Market Capitalisation was reported at approximately USD 2.18 billion.
- Trailing twelve-month diluted EPS was -USD 0.97.
- Lidar adoption depends on automotive, industrial, and robotics Demand cycles.
What Happened
Ouster, Inc. (NASDAQ:OUST) was among the most notable larger-cap names on Top Gaining US Stocks for 13 May 2026. The screener recorded a single-session change of 26.09% to USD 34.17, with reported volume of 14.65 million shares — 3.49 times the stock's typical activity.
With a market capitalisation of approximately USD 2.18 billion, Ouster sits at the top of the day's gainers in terms of size. A 26% move in a stock of this size is significant and typically reflects either material news, sector-wide repositioning, or a combination of the two.
The combination of a sizeable percentage move and a 3.5× volume spike in a multi-billion-dollar company points to a session in which both retail and institutional participants likely engaged with the name.
Market Context
The lidar sector has been one of the more volatile areas of the US Equity market over the past several years. Periods of optimism — driven by autonomous-vehicle progress, robotics deployments, and industrial automation announcements — have alternated with phases of caution as commercial timelines have proved longer than initially anticipated.
Within that broader environment, Ouster has historically been viewed as one of the larger pure-play lidar names. As such, its share price tends to respond not only to its own operational updates but also to news flow from larger autonomous-vehicle and industrial-automation players.
On 13 May 2026, OUST's move took place alongside several other thematic technology names, suggesting that risk appetite was actively rotating into sectors associated with automation, robotics, and advanced sensing. Such rotations can produce coordinated rallies even in the absence of company-specific news.
More structurally, the lidar market continues to evolve, with ongoing developments in solid-state designs, cost reduction, and integration into a broader range of vehicle and industrial platforms shaping the longer-term opportunity set.
Company Overview
Ouster, Inc. is a US-listed provider of lidar sensors used across automotive, industrial, robotics, and smart-infrastructure applications. The company is tracked under the ticker OUST.
As of the 13 May 2026 screener snapshot, OUST had a market capitalisation of approximately USD 2.18 billion, making it the largest of the day's gainers featured in this report. The trailing twelve-month diluted EPS figure of -USD 0.97 indicates ongoing operating losses, though smaller in per-share terms than many of the deeper-loss names on the screener.
From a market-behaviour standpoint, OUST has historically traded with the elevated Volatility characteristic of its sector, with sentiment swings sometimes producing significant single-session moves on relatively limited new information.
Screener Data
OUST's screener profile differs meaningfully from the day's micro-caps. With a USD 2.18 billion market capitalisation, the stock attracts a broader investor base, including institutional participants and dedicated thematic funds. As a result, the dynamics behind a 26% single-session move are typically more diverse than those driving similarly-sized moves in deeper micro-caps.
The relative volume reading of 3.49 is elevated but not extreme, suggesting that the move was supported by genuinely heightened participation rather than purely by structural illiquidity. Combined with a multi-billion-dollar market cap, the data describe a session of sector-wide interest rather than purely speculative micro-cap dynamics.
The trailing diluted EPS of -USD 0.97 reflects the cash-intensive nature of scaling a sensor-and-software Business. Investors should examine the underlying financials to assess the trajectory of Revenue, gross Margin, and operating expenses.
Risks to Watch
Adoption-timing risk
Lidar adoption in automotive, robotics, and industrial applications can take longer than initially projected. Slippage in customer deployment timelines can affect both revenue trajectory and competitive positioning.
Competitive intensity
Ouster operates in a competitive landscape that includes both pure-play lidar peers and larger sensor and automotive supplier groups. Maintaining technological Leadership requires sustained Investment.
Capital and dilution risk
Loss-making technology companies frequently raise capital to fund growth initiatives. Future equity issuance — whether through secondary offerings or convertible instruments — is a material consideration for shareholders.
Trading Patterns and Liquidity
Beyond the headline +26.09% change, the trading pattern visible from the screener provides a useful lens on how Ouster, Inc. actually moved through the session. The combination of a 34.17 USD reference level, reported volume of 14.65M, and a relative volume reading of 3.49 is informative in itself. Each of these figures captures a different facet of the market's reaction: price reflects the marginal valuation, volume measures aggregate participation, and relative volume contextualises that participation against the stock's own history.
In a market cap band reported at 2.18B USD, sustained moves typically require either a meaningful change in the perceived fundamental story or a substantial shift in the composition of the stock's investor base. One-day spikes that are not anchored in confirmed catalysts can be informative about market psychology but provide limited evidence about durable value creation. Traders evaluating OUST in the days that follow will want to watch whether the elevated volume profile is sustained, whether intraday ranges narrow, and whether bid-ask spreads tighten as the session's enthusiasm normalises.
Liquidity considerations also matter. When a stock's traded volume runs at multiples of its average, the order book can briefly look very different from its usual state. In particular, market depth — the size of resting orders at each price level — can appear larger than it really is during the spike and thinner than it really is once the rush fades. For OUST, that means execution conditions encountered during the 13 May 2026 session may not be representative of typical days, and investors should plan position sizing and exit strategies accordingly.
How This Move Compares to Other Top Gainers
Placing OUST's +26.09% move in context with other names on the 13 May 2026 Top Gaining US Stocks helps highlight what made the session distinctive. On the same day, leaderboard names ranged from deeply micro-cap issuers such as Dreamland Limited (TDIC) and Fitness Champs Holdings (FCHL) to larger small- and mid-caps like Ouster (OUST) and SELLAS Life Sciences (SLS). That breadth — both in sector and in market capitalisation — suggests the day's risk-on tone was broadly distributed rather than confined to a single theme.
Within that mixed cohort, OUST sat alongside companies from healthcare, advanced Manufacturing, energy transition, and financial services. Although each of these names has its own operating story, their simultaneous appearance on the screener illustrates a pattern frequently observed in US markets: when small- and micro-cap appetite returns, capital tends to disperse across themes rather than concentrate in one. That dispersion can itself be a signal worth tracking, because it differentiates broad-based risk-on sessions from sentiment events focused on a single sector.
The relative-volume reading of 3.49 for OUST should be read against the wide range observed in the day's gainers. Some names featured relative volumes in the high 20s, 30s, and even above 70, while others showed more moderate spikes in the 2–6 range. Where a particular stock sits in that distribution offers a clue about how unusual the day's activity was for that specific name — a more meaningful comparison than focusing solely on the headline percentage gain.
Investor Outlook
For OUST, the 13 May 2026 session reinforces the stock's sensitivity to lidar-sector sentiment and to broader risk appetite for emerging-technology themes. Whether the move marks a sustained re-rating depends on developments across the sector and on the company's own operational updates.
Long-term investors will continue to monitor revenue growth, design-win momentum, gross margin progression, and cash burn. These remain the fundamental indicators most likely to determine the stock's medium-term trajectory.
Active traders may pay attention to follow-on sessions and to the broader behaviour of the lidar complex, including peer-group price action and sector-related news flow. As ever, position sizing should reflect the elevated volatility typical of the segment.
Overall, Ouster's move illustrates how a meaningful shift in sentiment toward an emerging-technology theme can produce significant single-session gains even in stocks at the upper end of the small- and mid-cap range.


 Please wait processing your request...