
 CA
 NZ
 UK
 AU
 IND

 US

 Share
 X (Formerly Twitter)
 Whatsapp
 Facebook
 LinkedIn
 Telegram
 Email This Article
 Copy Link
 Summarize with AI
 Chat GPT
 Perplexity

The semiconductor complex is showing a unified up day after a shared arc over the past several months — a powerful rally into late spring/early summer highs, followed by a sharp, multi-week corrective decline into early July. NVIDIA (NASDAQ: NVDA), Tower Semiconductor (NASDAQ: TSEM), SanDisk (NASDAQ: SNDK), and Super Micro Computer (NASDAQ: SMCI) all posted solid gains today, ranging from roughly 1.6% to 4.9%, with SMCI and NVDA leading on a percentage basis. The moves look like a sector-wide relief bounce off recent lows, though positioning relative to the 20- and 50-day EMAs varies meaningfully across names — from NVDA, which has reclaimed both averages, to TSEM and SMCI, which remain below both, meaning today's strength is a bounce within a still-unresolved corrective phase for most of the group.
NVIDIA (NASDAQ: NVDA) — Strongest Reclaim in the Group, Back Above Both EMAs Near the 0.5 Fibonacci Level
Key Highlights
- NVDA trading at $204.52, up 3.85% ($7.59) on volume of 96.39M shares, after ranging between $195.06 and $204.57.
- Price has moved back above both the 20-day EMA ($201.83) and the 50-day EMA ($203.52) — the only name in the group to reclaim both averages today.
- RSI has jumped to roughly 51.4, with the signal line at 43.8, a sharp momentum pickup off recent soft readings.
- NVDA rallied from around $180 in March to a peak near $233 in early May, then corrected in a choppy decline back toward the $195 area, running directly into the 0.618 Fibonacci retracement level ($191.65) before today's bounce.
- Today's close sits right at the 0.5 Fibonacci retracement level ($200.17), which the stock has now cleared.
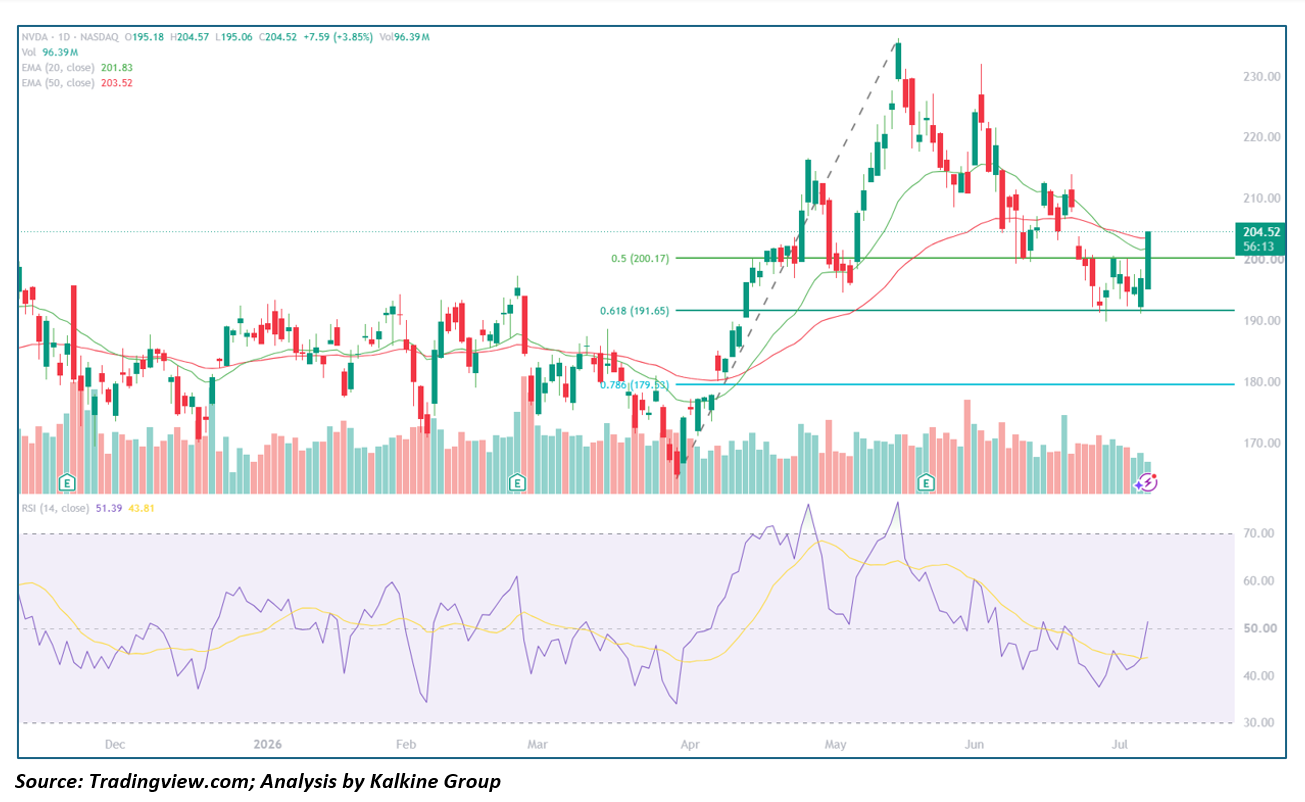
Trend Structure NVDA's chart shows a strong advance from March into a May peak near $233, followed by a choppy, lower-highs decline that tested the 0.618 retracement ($191.65) near the July lows. Today's rally is the first close back above both moving averages since the correction began, right at the 0.5 retracement level.
Key Technical Levels
Resistance
- $200.17 – 0.5 Fibonacci retracement (just reclaimed)
- $210.00 – June consolidation zone
Support
- $203.52 – 50-day EMA
- $201.83 – 20-day EMA
- $191.65 – 0.618 Fibonacci retracement
- $179.53 – 0.786 Fibonacci retracement
Outlook Holding above both EMAs and the 0.5 retracement would be the clearest sign yet that NVDA's correction from the May high is stabilizing. A failure to hold this zone would put the 0.618 level ($191.65) back in play.
Tower Semiconductor (NASDAQ: TSEM) — Sharp Bounce Off Lows, Still Well Below Both EMAs After Steep Multi-Week Decline
Key Highlights
- TSEM trading at $215.38, up 1.63% ($3.45) on volume of 920.7K shares, after ranging between $205.71 and $215.47.
- Price remains well below both the 20-day EMA ($247.52) and the 50-day EMA ($241.30), despite today's gain.
- RSI sits at roughly 39.3, with the signal line at 49.2, still in soft/bearish territory after a steep momentum decline from overbought levels above 70 in June.
- TSEM rallied from around $100 in November 2025 to a peak near $317 in June 2026, then broke down sharply over the following weeks to a low near $206.
- Today's bounce is a modest recovery attempt within that steep decline.
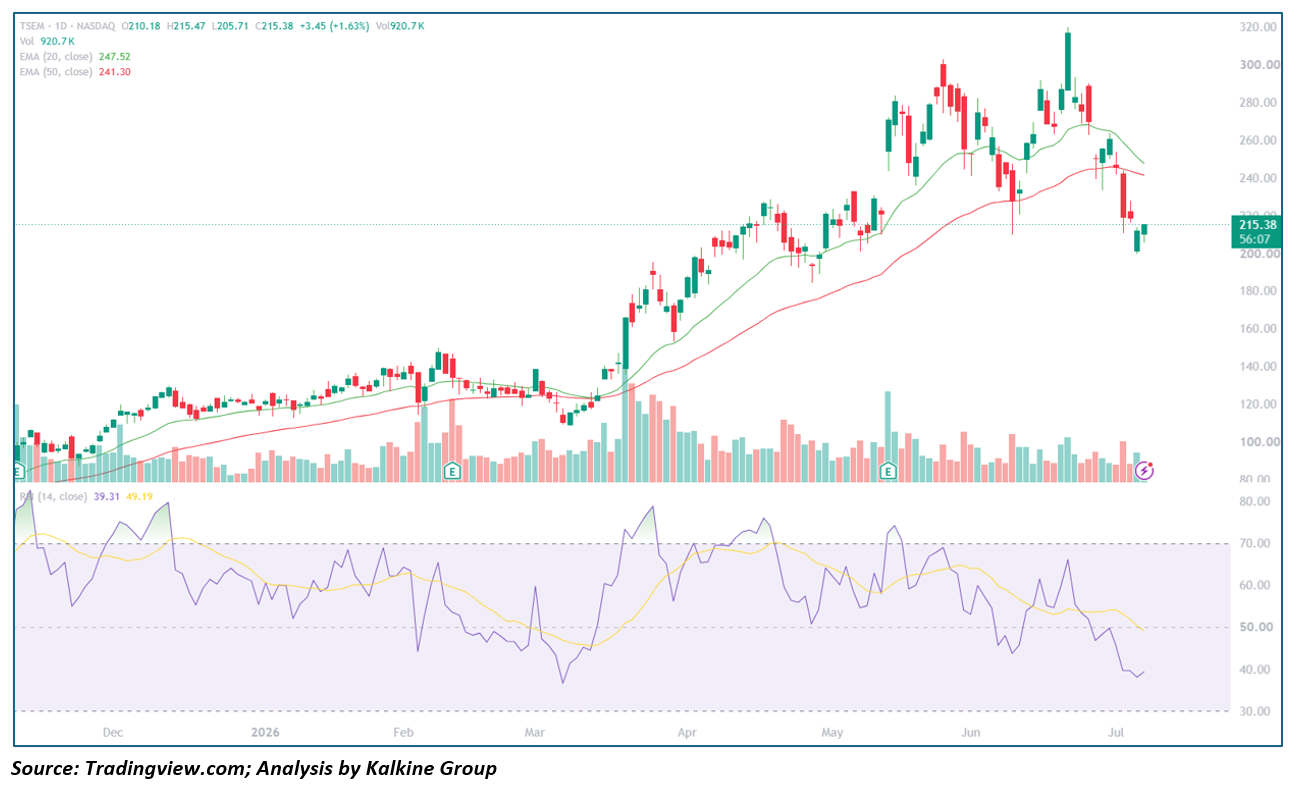
Trend Structure TSEM posted the largest percentage advance in the group into its June peak, more than tripling off November lows. The subsequent breakdown has been equally sharp, slicing through both moving averages and erasing a significant portion of the prior gains in a matter of weeks — the deepest correction among the five names covered here.
Key Technical Levels
Resistance
- $241.30 – 50-day EMA
- $247.52 – 20-day EMA
- $270.00 – Late-June consolidation zone
Support
- $205.71 – Today's low
- $200.00 – Round-number support
- $180.00 – April consolidation zone
Outlook Given the depth and speed of the decline, today's bounce is best treated as an oversold relief move rather than a trend change. A reclaim of the 50-day EMA near $241 would be needed to suggest the correction is stabilizing.
SanDisk (NASDAQ: SNDK) — Volatile Snapback After Sharp Pullback From All-Time Highs
Key Highlights
- SNDK trading at $1,675.47, up 3.57% ($57.77) on volume of 9.22M shares, after a wide range between $1,590.00 and $1,707.33.
- Price remains below the 20-day EMA ($1,873.94) but above the 50-day EMA ($1,647.05), sitting between the two averages after a sharp break.
- RSI has recovered to roughly 45.5, with the signal line at 57.2, still soft after a steep momentum decline from extreme overbought levels near the June peak.
- SNDK staged one of the largest advances in the group, rallying from around $250 in November 2025 to a peak near $2,350 in June 2026, before a sharp multi-session decline knocked price down toward $1,590.
- Today's session shows a wide, volatile range with a strong close near the highs.
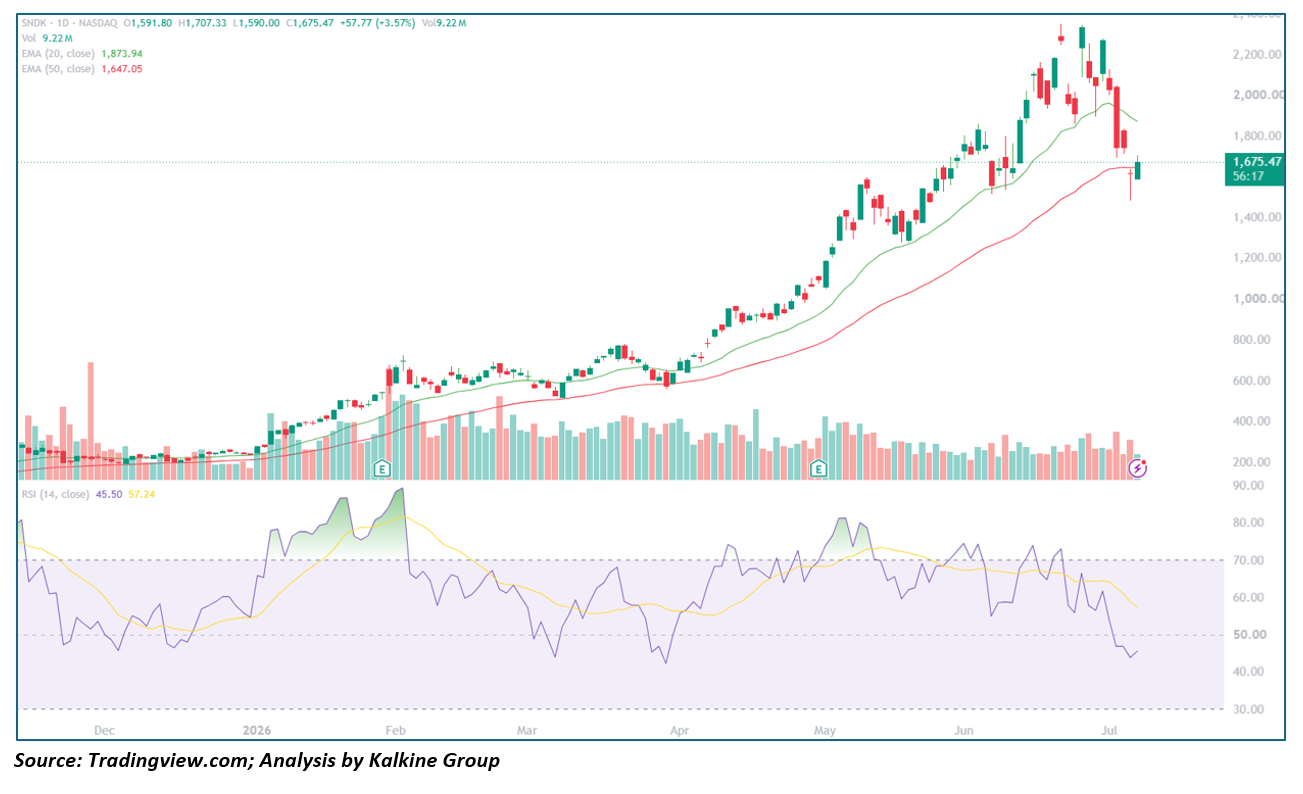
Trend Structure SNDK's parabolic advance from late 2025 through June 2026 was the steepest in the group by far, and the subsequent pullback has been similarly sharp and volatile. Price has broken below the 20-day EMA but is holding above the 50-day EMA for now, leaving the intermediate-term trend technically intact despite the violent short-term swing.
Key Technical Levels
Resistance
- $1,873.94 – 20-day EMA
- $2,000.00 – Round-number resistance
- $2,350.00 – June all-time high
Support
- $1,647.05 – 50-day EMA
- $1,590.00 – Today's low
- $1,400.00 – Prior consolidation zone
Outlook Holding above the 50-day EMA near $1,647 would keep the broader uptrend structurally intact. A break below that level would open the door to a deeper retracement given how extended the prior advance became.
Super Micro Computer (NASDAQ: SMCI) — Largest Percentage Gainer of the Session, Still Below Both EMAs After Sharp Reversal From June Peak
Key Highlights
- SMCI trading at $27.53, up 4.86% ($1.27) on volume of 25.48M shares, after ranging between $26.03 and $27.60.
- Price remains below both the 20-day EMA ($30.68) and the 50-day EMA ($32.03), with the 20-day EMA now below the 50-day EMA — a bearish crossover.
- RSI sits at roughly 41.4, with the signal line at 42.8, recovering modestly after a sharp drop from an overbought reading above 75 in June.
- SMCI spent late 2025 in a steady downtrend from around $45 to a March 2026 low near $24, then rallied sharply to a peak near $50 in June, before reversing hard back to current levels.
- Today's session is the strongest single-day percentage gain among all five names covered.
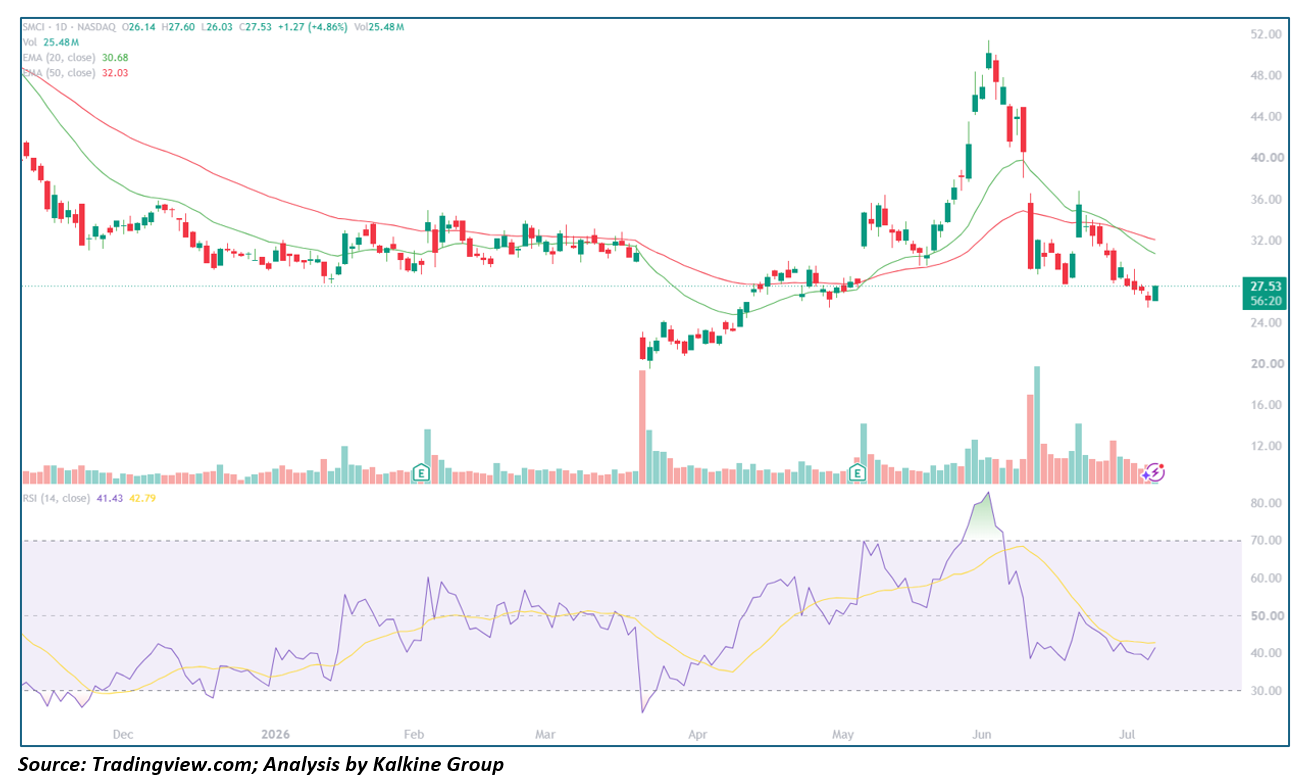
Trend Structure SMCI's chart shows a volatile, high-beta round trip: a multi-month decline into March lows, a swift more-than-doubling rally into the June peak, and then an equally swift reversal that has erased most of that advance. The bearish EMA crossover (20-day below 50-day) reflects the severity of the recent pullback.
Key Technical Levels
Resistance
- $30.68 – 20-day EMA
- $32.03 – 50-day EMA
- $40.00 – Late-June consolidation zone
Support
- $26.03 – Today's low
- $24.00 – March 2026 low
- $22.00 – Prior base
Outlook Today's outsized percentage gain is a notable oversold bounce, but with both EMAs still sloping down and price beneath them, a reclaim of the 20-day EMA near $31 would be needed to suggest the sharp June-to-July decline is stabilizing.
This analysis is based on daily chart technical indicators (20/50-day EMAs, RSI-14) and price action as of July 8, 2026, and is intended for informational purposes only — not investment advice.


 Nov 13, 2026





 Please wait processing your request...