
 CA
 NZ
 UK
 AU
 IND

 US

 Share
 X (Formerly Twitter)
 Whatsapp
 Facebook
 LinkedIn
 Telegram
 Email This Article
 Copy Link
 Summarize with AI
 Chat GPT
 Perplexity

Today's session was split across this group of storage, memory, and networking names. Western Digital (NASDAQ: WDC), Sandisk (NASDAQ: SNDK), Seagate Technology (NASDAQ: STX), and Viavi Solutions (NASDAQ: VIAV) all posted modest gains after steep multi-week corrections from major cycle highs, with each still trading well below its 20-day and 50-day EMAs. By contrast, Fastly (NASDAQ: FSLY) and ViaSat (NASDAQ: VSAT) both slipped today after firmer recent rallies — FSLY holding just above its EMA cluster despite the pullback, while VSAT settled back toward its 50-day EMA after a sharp two-week run.
Western Digital Corporation (NASDAQ: WDC) — Bouncing After a Steep Break From All-Time Highs
Key Highlights
- WDC trading at $487.38, up 2.13% ($10.16) on volume of 4.24M shares, after ranging between $485.35 and $505.99.
- Price remains well below both the 20-day EMA ($552.00) and the 50-day EMA ($533.64), both of which have begun rolling over.
- RSI sits at roughly 41.23, with the signal line at 46.16, having fallen sharply from overbought territory above 70 reached in June.
- WDC rallied from a January 2026 low near $180 to a July high near $795, then reversed into one of the sharpest multi-week declines of the entire advance, briefly touching the mid-$400s before today's bounce.
- Today's gain is a modest recovery attempt after a decline that erased a substantial portion of the June–July rally in just a few sessions.
Trend Structure WDC's chart shows a powerful, near-uninterrupted climb from the January low through the July peak, followed by an abrupt trend break — price has now closed below both EMAs for the first time since the rally began, with the 20-day EMA crossing below its own recent highs. 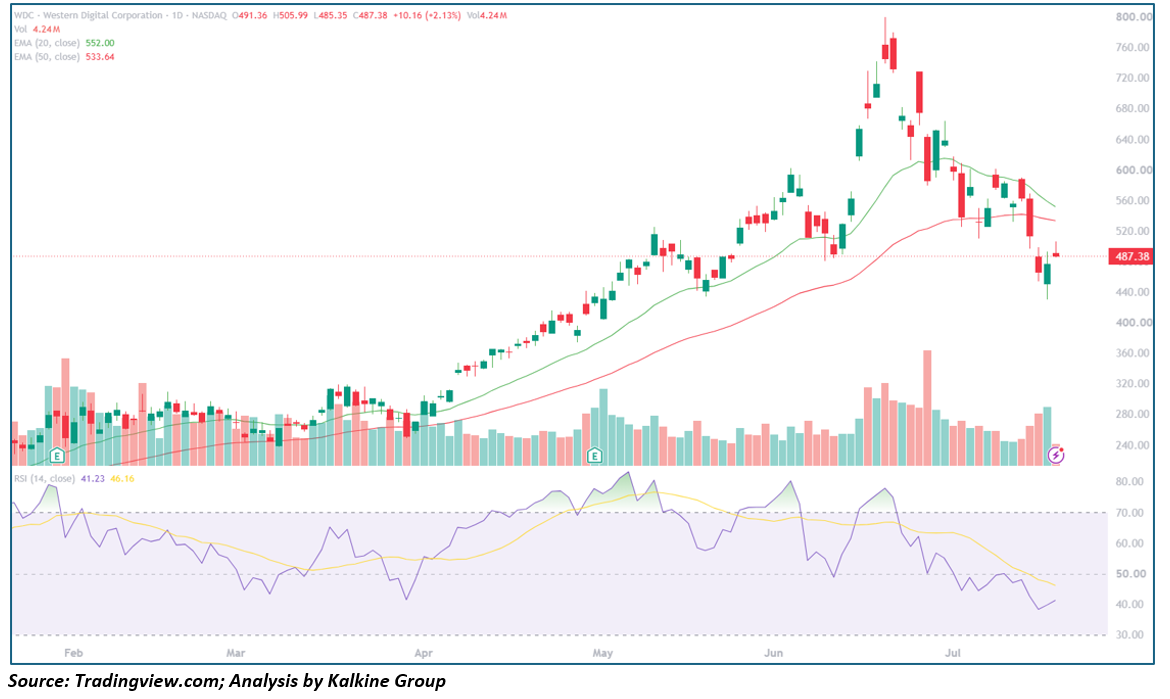
Key Technical Levels Resistance
- $533.64 – 50-day EMA
- $552.00 – 20-day EMA
- ~$795.00 – July 2026 cycle high Support
- ~$440.00 – This week's low
- ~$400.00 – Early July 2026 consolidation zone
Outlook WDC's bounce comes after one of the steepest corrections in the group, and with both EMAs still well overhead and sloping lower, this reads as an early stabilization attempt rather than a confirmed reversal. Reclaiming the 50-day EMA near $534 would be the first real sign of repair; a break of this week's low would open the door to a deeper retracement.
Sandisk Corporation (NASDAQ: SNDK) — Breaking a Multi-Month Support Shelf Before Today's Bounce
Key Highlights
- SNDK trading at $1,390.52, up 2.64% ($35.70) on volume of 10.94M shares, after ranging between $1,375.61 and $1,454.99.
- Price remains sharply below both the 20-day EMA ($1,713.52) and the 50-day EMA ($1,636.92).
- RSI sits at roughly 39.90, with the signal line at 47.10, falling fast after overbought readings above 70 in May.
- SNDK rallied from a January 2026 low near $400 to a May high near $2,380, then spent several weeks consolidating in a marked support band roughly between $1,550 and $1,650 before breaking decisively below it over the past several sessions.
- Today's bounce follows a sharp breakdown through that support shelf, with price now trading several hundred dollars beneath it.
Trend Structure SNDK's chart shows an explosive January–May advance, a multi-month sideways consolidation that repeatedly held the $1,550–$1,650 zone, and then a decisive breakdown through that shelf in the past two weeks — today's session is the first attempted bounce since that breakdown occurred. 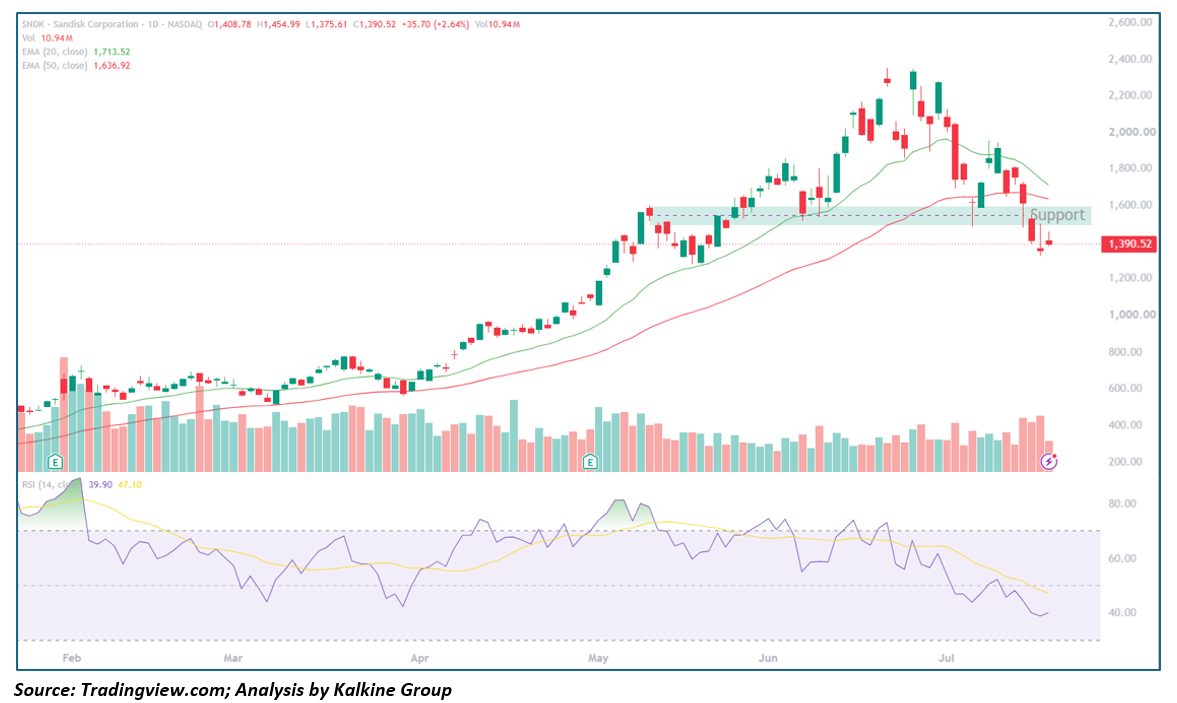
Key Technical Levels Resistance
- $1,550.00–$1,650.00 – Former support shelf, now overhead resistance
- $1,636.92 – 50-day EMA
- ~$2,380.00 – May 2026 cycle high Support
- ~$1,375.00 – Today's low
- ~$1,200.00 – March 2026 breakout zone
Outlook SNDK's break of a well-established multi-month support shelf is a significant technical development, and today's bounce has not yet reclaimed that former support-turned-resistance zone. A close back above $1,550–$1,650 would suggest the breakdown was a shakeout; continued weakness below today's low would confirm the shelf has failed.
Viavi Solutions Inc. (NASDAQ: VIAV) — Steady Bounce Off Multi-Month Lows
Key Highlights
- VIAV trading at $39.43, up 3.33% ($1.27) on volume of 2.92M shares, after ranging between $38.66 and $40.36.
- Price remains below both the 20-day EMA ($42.97) and the 50-day EMA ($44.88).
- RSI sits at roughly 40.05, with the signal line at 39.58, stabilizing after a multi-week decline.
- VIAV rallied from a January 2026 low near $13 to an April spike high near $58, consolidated through May and June in the $48–$56 range, and then broke down into a steady decline that brought price to its lowest level since March before today's bounce.
- Today's gain is a modest recovery after a multi-week slide that retraced a large portion of the spring advance.
Trend Structure VIAV's chart shows a powerful January–April rally capped by a sharp spike high, a multi-month sideways-to-lower consolidation, and then an accelerating decline over the past several weeks that has now pulled price back toward levels last seen in March, with today's session marking the first notable bounce. 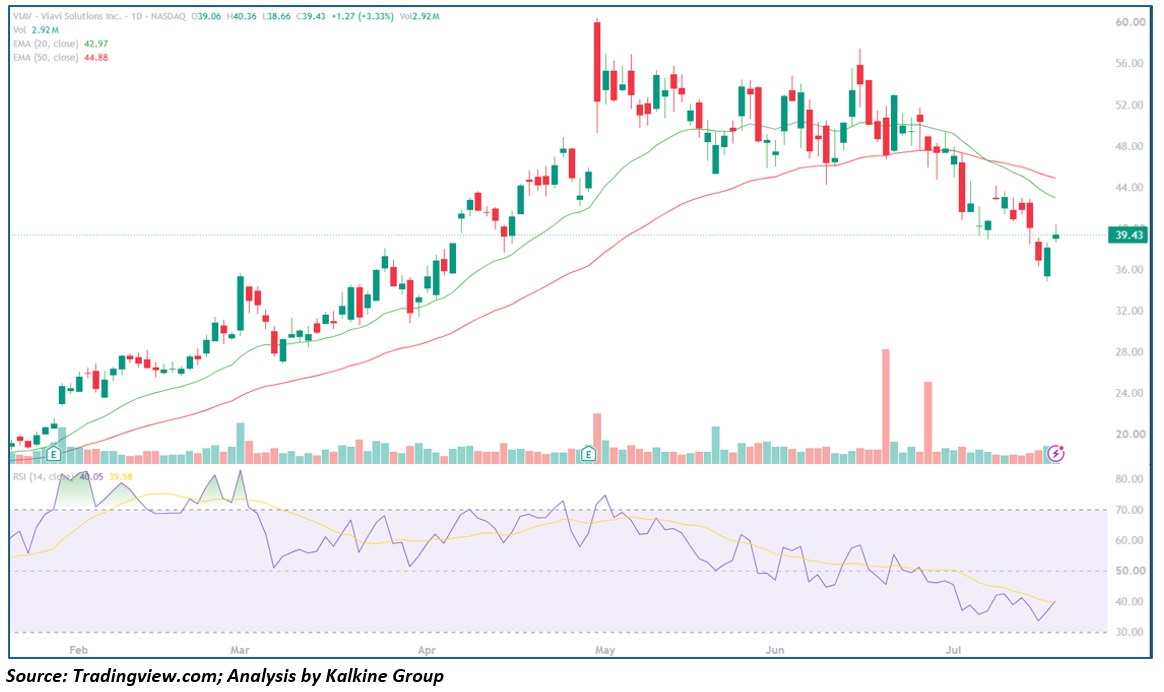
Key Technical Levels Resistance
- $42.97 – 20-day EMA
- $44.88 – 50-day EMA
- ~$48.00 – May–June consolidation floor Support
- ~$36.50 – This week's low
- ~$32.00 – March 2026 consolidation zone
Outlook VIAV's bounce is a constructive early sign after a multi-week slide, but the stock remains well below both EMAs following a large retracement of its spring rally. A close back above the 20-day EMA near $43 would strengthen the case for stabilization; a break of this week's low would risk a deeper slide toward the $32 zone.
Seagate Technology Holdings PLC (NASDAQ: STX) — Bouncing After a Sharp Break From Cycle Highs
Key Highlights
- STX trading at $802.82, up 1.92% ($15.16) on volume of 4.37M shares, after ranging between $797.02 and $831.64.
- Price remains below both the 20-day EMA ($866.62) and the 50-day EMA ($835.89).
- RSI sits at roughly 43.66, with the signal line at 45.83, down sharply from overbought readings above 70 reached in April and June.
- STX rallied from a January 2026 low near $380 to a July high near $1,100, then reversed into a steep multi-week decline that has brought price back below the 50-day EMA for the first time since the rally began.
- Today's bounce follows one of the sharpest pullbacks of the entire advance, with price recovering modestly after briefly dipping toward $797.
Trend Structure STX's chart shows a strong, sustained January–July advance followed by an abrupt reversal — price has broken below both EMAs in quick succession over the past two weeks, a clear change in character from the orderly uptrend that preceded it. 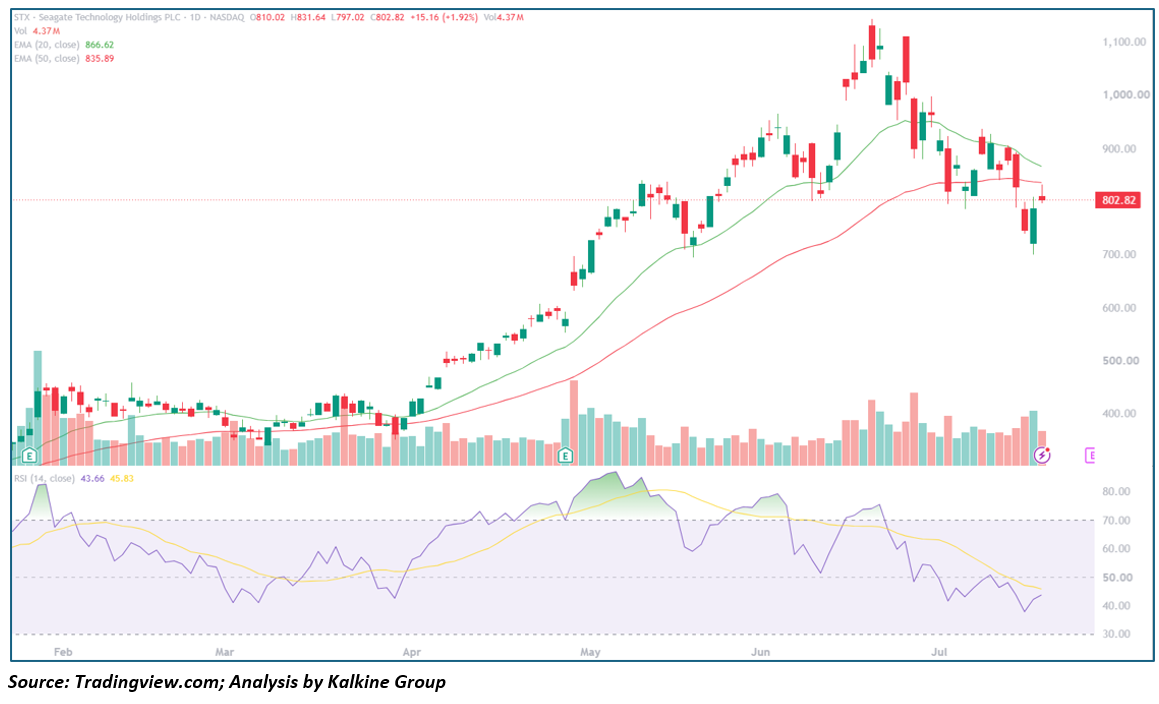
Key Technical Levels Resistance
- $835.89 – 50-day EMA
- $866.62 – 20-day EMA
- ~$1,100.00 – July 2026 cycle high Support
- ~$797.00 – Today's low
- ~$700.00 – May 2026 breakout zone
Outlook STX's bounce is a modest positive after a sharp technical breakdown, but with price still well under both EMAs, the near-term trend has clearly shifted from the prior uptrend. Reclaiming the 50-day EMA near $836 would be the first step toward stabilization; a slide below today's low would point to further downside toward the $700 zone.
Fastly, Inc. (NASDAQ: FSLY) — Modest Pullback, Still Holding Above the EMA Cluster
Key Highlights
- FSLY trading at $20.47, down 1.23% ($0.25) on volume of 2.55M shares, after ranging between $20.21 and $21.27.
- Price remains above both the 20-day EMA ($19.41) and the 50-day EMA ($19.57), despite today's small decline.
- RSI sits at roughly 57.39, with the signal line at 55.10, holding in constructive territory above the midpoint.
- FSLY has been notably volatile, gapping sharply higher in February and again in May, rallying to an April high near $33 before a steep pullback to a May low near $16, and again to a July low near $16 before a fresh rally back to current levels.
- Today's modest pullback comes after a strong multi-week recovery off the July low, with price still holding well above both EMAs.
Trend Structure FSLY's chart shows a series of sharp, event-driven rallies and reversals — two major gap-ups followed by steep giveback each time — with the most recent leg being a recovery off the July low that has carried price back above both moving averages for the first time in several weeks. 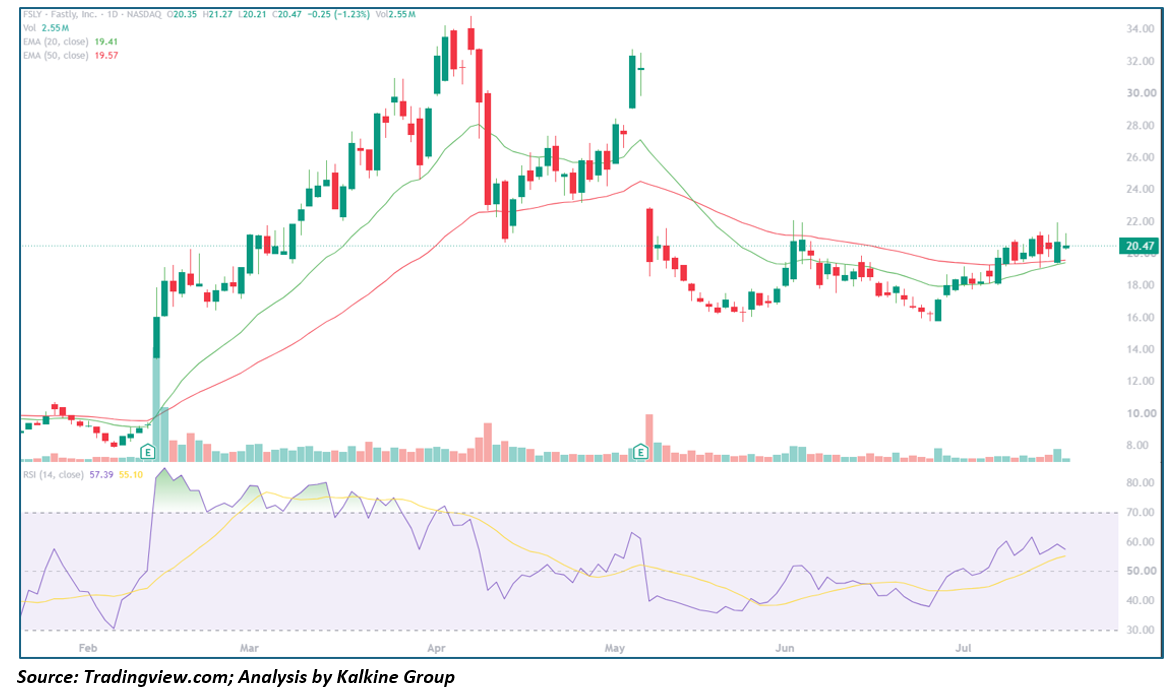
Key Technical Levels Resistance
- ~$24.00 – June 2026 consolidation high
- ~$28.00 – May 2026 gap-up high Support
- $19.57 – 50-day EMA
- $19.41 – 20-day EMA
- ~$16.00 – July 2026 low
Outlook FSLY's slight pullback looks like normal digestion within a recovering trend, with both EMAs still acting as support beneath current levels. Holding above the $19.40–$19.60 zone would keep the recent recovery intact; a break below it would suggest the bounce off the July low is losing momentum.
ViaSat, Inc. (NASDAQ: VSAT) — Pulling Back Toward the 50-Day EMA After a Sharp Two-Week Rally
Key Highlights
- VSAT trading at $69.53, down 2.73% ($1.95) on volume of 926.49K shares, after ranging between $69.22 and $74.10.
- Price is testing the 50-day EMA ($69.35) from above, while sitting below the 20-day EMA ($71.65).
- RSI has fallen to roughly 47.77, with the signal line at 53.48, cooling off from overbought readings above 70 reached in early July.
- VSAT rallied from a January 2026 low near $18 to a July high near $91, with the advance punctuated by two especially sharp rally legs — one into early June and a steeper one in early July — each followed by a fast retracement.
- Today's decline extends a pullback from the July high, bringing price down to test the 50-day EMA.
Trend Structure VSAT's chart shows a strong, if choppy, January–July advance built from a series of steep rally-and-pullback cycles; the most recent cycle saw a sharp early-July spike to fresh highs followed by an equally fast retracement that has now reached the 50-day EMA. 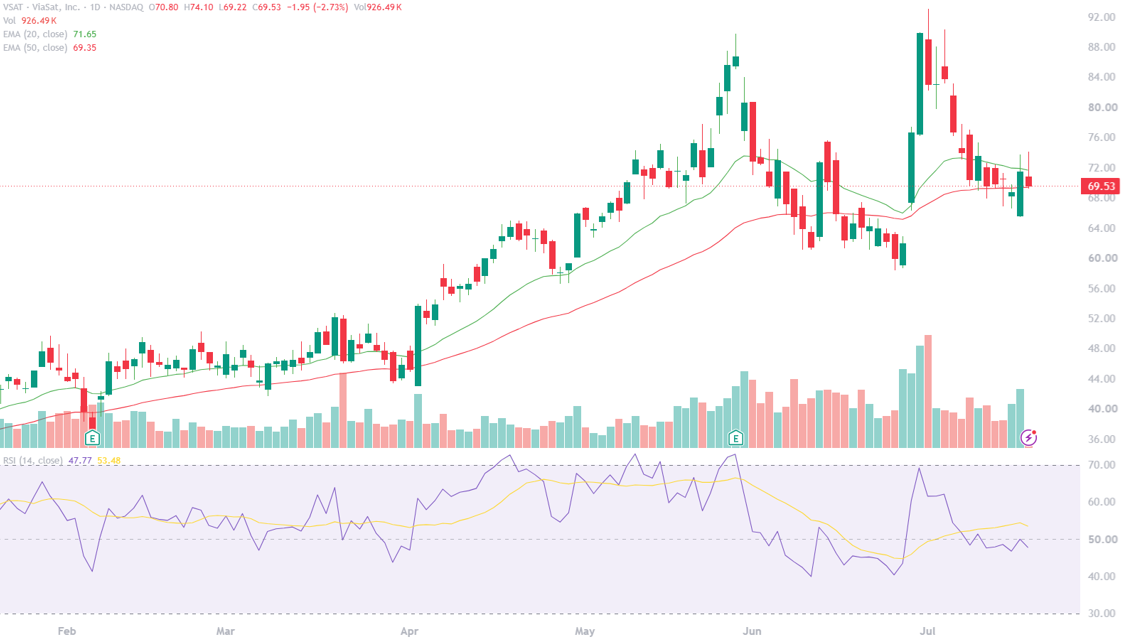 Source: Tradingview.com; Analysis by Kalkine Group
Key Technical Levels Resistance
- $71.65 – 20-day EMA
- ~$78.00 – Mid-July 2026 consolidation zone
- ~$91.00 – July 2026 cycle high Support
- $69.35 – 50-day EMA
- ~$60.00 – Late June 2026 pullback low
Outlook VSAT's pullback to the 50-day EMA is consistent with the stock's pattern of sharp rallies followed by equally sharp retracements. Holding the 50-day EMA near $69 would keep the broader uptrend intact; a break below it would risk a deeper slide back toward the $60 zone.
This analysis is based on daily chart technical indicators (20/50-day EMAs, RSI-14) and price action as of July 20, 2026, and is intended for informational purposes only — not investment advice.


 Nov 10, 2026





 Please wait processing your request...