_05_20_2026_00_03_17_067283.jpg)
Key Highlights
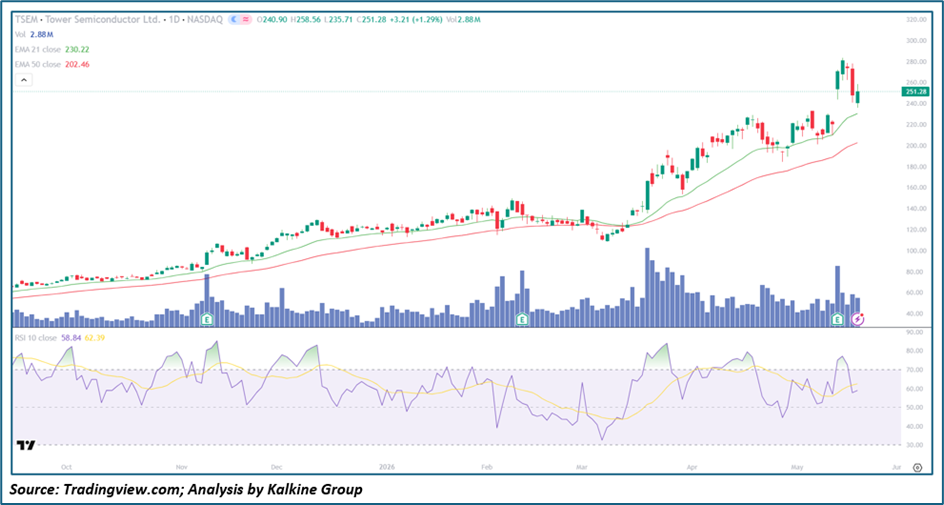
- Tower Semiconductor (TSEM) is trading near $251.28, pulling back from recent highs of ~$280 after a parabolic multi-month rally
- Price remains above both EMA-21 (~$230.22) and EMA-50 (~$202.46), confirming the broader bullish structure is intact
- RSI-10 at ~58.84 has cooled from overbought levels near 80, entering a neutral-bullish reset zone
- Volume spiked on the pullback but price is recovering intraday — suggesting the dip is being bought, not sold into
- The overall trend remains strongly bullish; current weakness looks corrective, not Reversal
Trend Structure: Strong Uptrend Taking a Breather
Tower Semiconductor has been in a powerful, sustained uptrend since October 2025, rallying from levels near $60 to a recent high of approximately $280 — a gain of over 350% in under eight months. The move has been driven by surging Demand for AI-related semiconductor capacity, with TSEM benefiting directly as a contract chipmaker serving high-growth fabless customers.
The recent pullback, which brought price down to an intraday low of ~$235 before recovering to $251, is the first meaningful Retracement in several weeks. Importantly, the structure of higher highs and higher lows remains intact. Both moving averages continue to slope upward, and price has not broken below either — a key distinction that separates this from a trend reversal.
The current zone between $235 and $255 is emerging as a short-term decision area. Bulls need to defend this range to keep the bullish structure alive.
RSI Setup: Healthy Reset, Not Exhaustion
The RSI-10 reading of 58.84 tells an important story. Just weeks ago, RSI was pushing into the 75–80 range as the stock went parabolic — a level that historically signals short-term overextension. The current pullback has reset momentum to a neutral-bullish zone, relieving that overheated condition without breaking down.
The signal line (yellow) sits at 62.39, slightly above the RSI line, suggesting the fast momentum has dipped below its average in the near term. This is a mild caution signal, but well within the range of normal consolidation behavior in a strong uptrend. There is meaningful room for RSI to re-accelerate higher before reaching overbought territory again.
Moving Averages: Both Acting as Support, Not Resistance
Unlike a bearish setup where moving averages act as a ceiling, TSEM's Moving Average structure is firmly supportive:
- EMA-21 (~$230.22) — immediate dynamic support; the first level bulls must defend on any further weakness
- EMA-50 (~$202.46) — major trend support; a test of this level would represent a ~20% pullback from highs and would likely attract significant buying interest
Both EMAs are rising steeply, reflecting the strength of the underlying trend. A healthy pullback into the EMA-21 zone around $230 would be a textbook continuation setup — the kind of dip that trend-following investors look to buy.
Volume: Elevated But Not Alarming
Volume came in at 2.88 million shares — elevated relative to recent sessions. High volume on a down move warrants attention, but the intraday recovery (price closed well above the session low of $235) suggests that buyers stepped in during the weakness. This price action — a sharp dip followed by a close well off the lows — is often a sign of absorption rather than distribution.
If volume begins to recede as price stabilizes and recovers, that would further confirm that the pullback is corrective in nature.
Key Technical Levels and Scenarios
Resistance Levels
- $258–$260 — session high and near-term ceiling
- $270–$275 — prior consolidation band
- $280+ — recent all-time high and psychological target
Support Levels
- $235–$240 — session low and immediate base zone
- $230 — EMA-21 and key dynamic support
- $202 — EMA-50 and major trend support
Scenarios
- Bullish Continuation (Primary Case) — Price holds above EMA-21, RSI re-accelerates, and TSEM pushes back toward $270–$280 to retest recent highs. A close above $260 would be the first confirmation signal.
- Consolidation / Base Formation (Secondary Case) — Stock ranges between $230–$260, digesting the extended rally while EMAs catch up to price. This would be a constructive outcome that sets up the next leg higher.
- Deeper Pullback (Risk Case) — A break below EMA-21 at $230 opens a test of $202 (EMA-50). The most likely trigger would be a broader semiconductor sector selloff, particularly if Nvidia's Earnings disappoint this week.
Conclusion: Healthy Pullback in a Strong Uptrend — Watch $230 as the Line in the Sand
Tower Semiconductor remains one of the strongest charts in the semiconductor space, with a structural uptrend that has delivered exceptional gains since late 2025. The current pullback from ~$280 highs is a normal and healthy corrective move within that broader trend — not a reversal signal.
As long as price holds above the EMA-21 at $230, the path of least resistance remains higher. RSI has reset from overbought conditions to a more sustainable level, and the moving average structure continues to support the bull case.
This is the kind of setup where patient trend followers look to add on weakness — with the EMA-21 as the key level to watch and $280 as the next major target on a resumption of the uptrend.


 Please wait processing your request...