
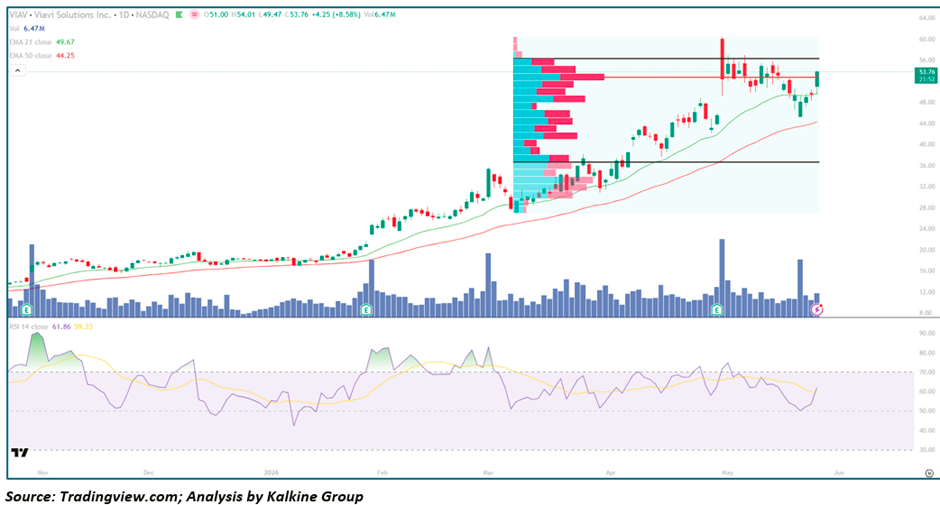
A decisive break above the high-Volume node resistance zone, RSI-14 building constructively from mid-range, and today's session volume surging to 6.47M — Viavi Solutions Inc. (Nasdaq: VIAV) is staging a technically exceptional breakout that the Fixed Range Volume Profile confirms is a move of the highest significance
Key Highlights
- Viavi Solutions Inc. (NASDAQ: VIAV) closed at $53.76, surging +$4.25 (+8.58%) in a powerful breakout session that clears a major volume profile resistance zone and retests the prior highs
- Price traded between $49.47 and $54.01 intraday, closing near the session high — confirming aggressive and sustained institutional buying throughout the entire day
- The stock is trading comfortably above both the EMA-21 ($49.67) and EMA-50 ($44.25), confirming a firmly bullish trend structure with both averages rising steeply in bullish alignment
- RSI-14 at 61.86 with signal at 59.33 — advancing constructively toward overbought territory with the main line above the signal line, confirming a fresh and active bullish crossover
- Volume surged to 6.47M shares — one of the largest single-session readings in the chart, providing powerful institutional confirmation behind today's breakout
- Viavi Solutions Inc. (NASDAQ: VIAV) has rallied from below $30 in late February to above $53 — a gain of over 75% in approximately 13 weeks — making it one of the most explosive performers in the network technology space
Understanding the Fixed Range Volume Profile Indicator
The Fixed Range Volume Profile (FRVP) plotted on Viavi Solutions Inc. (NASDAQ: VIAV)'s chart is one of the most sophisticated and institutionally respected tools in Technical Analysis. Unlike standard volume indicators that simply show how many shares traded on a given day, the Fixed Range Volume Profile displays the distribution of trading volume across specific price levels over a defined period — revealing exactly where the most and least institutional activity has occurred within a chosen price range.
On this chart, the FRVP has been applied to the February–March 2026 corrective and consolidation period, producing the horizontal histogram bars visible on the left side of the price action. Each horizontal bar represents the total volume traded at that price level during the selected period — longer bars indicate price levels where heavy trading activity occurred, while shorter bars indicate price levels where relatively little activity took place.
The key components and their significance:
The Point of Control (POC) is the single longest bar in the profile — the price level where the greatest volume of shares exchanged hands during the measurement period. On Viavi Solutions Inc. (NASDAQ: VIAV)'s chart, this appears near the $36–$37 zone, represented by the longest pink and teal bars. The POC acts as a powerful magnetic level — price tends to gravitate toward it during corrections and use it as a pivot when trends resume.
High Volume Nodes (HVNs) are clusters of long bars in the profile, indicating price levels where significant two-sided trading activity occurred. These zones act as areas of strong support and resistance because they represent price levels where large numbers of institutional participants established positions. The prominent HVN cluster visible between $36 and $54 on Viavi Solutions Inc. (NASDAQ: VIAV)'s chart represents the accumulated positions of participants who traded during the consolidation period — many of whom become sellers when price returns to their cost basis.
Low Volume Nodes (LVNs) are the short bars in the profile, indicating price levels where very little trading activity occurred. These thin zones act as price vacuum areas — when price enters a low-volume node, it tends to move rapidly through it with minimal resistance, explaining the velocity of certain advances and declines. The narrow LVN region visible near $54–$56 on the chart suggests that if Viavi Solutions Inc. (NASDAQ: VIAV) clears the current resistance zone, the next move higher could be swift and significant.
The two black horizontal lines on the chart demark the upper and lower boundaries of the Fixed Range Volume Profile measurement period — the precise price range within which the volume distribution has been calculated. Everything between these lines represents the battleground where institutional participants accumulated and distributed positions during the consolidation.
What the FRVP tells us about today's move: Today's close at $53.76 pushes Viavi Solutions Inc. (NASDAQ: VIAV) through the upper portion of the high-volume node cluster and into the low-volume node region above $54. This is technically significant — it means price is breaking out of the heavy congestion zone where sellers have been most active and entering price territory where overhead Supply is thin. When a stock clears a high-volume resistance cluster on a session like today's 6.47M share volume, it signals that buyers have absorbed the available supply at those levels and that the path of least resistance has shifted decisively higher.
Trend Structure: From Prolonged Base to Explosive Breakout
Phase 1 — Prolonged Base &Amp; Quiet Accumulation (Nov 2025 – Jan 2026)
Viavi Solutions Inc. (NASDAQ: VIAV) spent the final months of 2025 in a tight, low-energy consolidation near the $17–$21 range:
- Both EMAs flat and compressed, reflecting a market in equilibrium
- Volume minimal throughout the period with no meaningful directional conviction
- A November Earnings event produced a brief volume spike but failed to generate sustained follow-through
- Price action remained range-bound and unremarkable — masking what would become a powerful accumulation phase
- The extended dormancy created the foundational energy for the subsequent explosive advance
Phase 2 — Momentum Ignition & Vertical Surge (Feb – Mar 2026)
The character of the chart changed completely in February 2026:
- A February earnings catalyst ignited an extraordinary acceleration from the $22–$24 zone toward $60 in a near-vertical move
- Volume surged to multi-month highs on the strongest breakout sessions
- Both EMAs turned aggressively higher as price pulled decisively above them
- RSI-14 pushed into overbought territory above 70 and sustained elevated readings throughout the surge
- The advance from $22 to $60 in weeks represented one of the most powerful single-phase moves in the chart — a fundamental re-rating driven by institutional conviction
The velocity and magnitude of this move established Viavi Solutions Inc. (NASDAQ: VIAV) as a high-conviction momentum leader within the network technology thematic.
Phase 3 — Volume Profile Consolidation & Breakout (Mar – May 2026)
Following the initial vertical surge, Viavi Solutions Inc. (NASDAQ: VIAV) entered the consolidation phase captured by the Fixed Range Volume Profile:
- Price retraced from the $60 highs toward the $30–$36 support zone — precisely where the POC of the volume profile sits
- The consolidation built a dense volume distribution between $36 and $54 — the HVN cluster that has defined resistance for the past two months
- RSI-14 cycled repeatedly between 50 and 80 throughout the consolidation, never reaching deeply oversold territory
- Each earnings event within the period produced elevated volume and brief price surges, maintaining institutional engagement
- Today's session breaks decisively above the upper HVN boundary near $52–$54 and into the low-volume node region — the most significant technical development since the initial February breakout
Moving Averages: Maximum Bullish Configuration
The EMA-21 at $49.67 is rising at its steepest angle since the February breakout phase, sitting approximately 8% below current price. It has consistently acted as dynamic support during every pullback within the April–May advance and remains the primary reference level for momentum traders. The EMA-21 now sits within the high-volume node cluster — meaning any pullback to this level would encounter both dynamic EMA support and the accumulated Demand of institutional participants who established positions in the $48–$50 zone.
The EMA-50 at $44.25 has turned steeply higher after the consolidation phase, sitting approximately 18% below current price. The widening gap between EMA-21 and EMA-50 — currently over $5 and expanding — confirms that trend velocity is accelerating. The EMA-50 sits near the POC of the volume profile, creating a powerful confluence of support that would need to be decisively breached before the broader bull thesis is threatened.
Momentum Analysis: RSI-14 Advancing From Mid-Range — Ample Runway Remaining
RSI-14 at 61.86 with the signal line at 59.33 is positioned in the upper-middle of its range — neither overbought nor oversold — with the main line above the signal line confirming a fresh bullish crossover that aligns precisely with today's price breakout. This is the most attractive RSI configuration for momentum continuation: enough strength to confirm genuine buying pressure, but not so extended that near-term exhaustion is imminent.
The RSI pattern on Viavi Solutions Inc. (NASDAQ: VIAV)'s chart shows a consistent behaviour — RSI has reached the 70–80 zone multiple times throughout the chart and on each occasion has been followed by further price advances before any meaningful correction. The current reading of 61.86 suggests the oscillator has room to reach those elevated levels again, which historically has corresponded to the strongest phases of the price advance.
Volume Analysis: 6.47M Shares Confirms Institutional Absorption of Supply
Today's volume of 6.47M is among the highest single-session readings in the chart and arrives at the precise technical moment where it carries maximum significance — a breakout above the upper boundary of the Fixed Range Volume Profile's high-volume node cluster. This volume magnitude confirms that institutional buyers absorbed the available supply from participants who had accumulated positions within the $36–$54 HVN zone and who were ready to sell as price returned to their cost basis.
The volume structure throughout the recovery from the March lows has been exemplary — elevated on breakout sessions, lighter on pullback days, with no heavy-volume Reversal sessions indicating aggressive distribution. The overall profile is consistent with a stock under genuine institutional accumulation.
Key Technical Levels
Resistance Levels
- $54.01 — today's intraday high and immediate session resistance
- $56.00 — upper black horizontal line and top of the Fixed Range Volume Profile measurement zone
- $59–$60 — prior February 2026 all-time high zone and ultimate bull case resistance
- $65+ — extended momentum target if the all-time highs are cleared convincingly
Support Levels
- $52.00–$52.50 — upper HVN cluster boundary — now critical support after today's breakout
- EMA-21 at $49.67 — primary dynamic support and key pullback buy zone within the HVN
- $46–$48 — mid-HVN cluster and secondary volume support
- POC near $36–$37 — Point of Control and major structural support
- EMA-50 at $44.25 — structural support converging with the HVN zone
Scenario Analysis
- Bullish Continuation (Primary Case)
Viavi Solutions Inc. (NASDAQ: VIAV) sustains above the upper HVN boundary near $52–$54: → Price advances through the thin low-volume node region above $54 rapidly toward the $56 upper profile boundary → A clean close above $56 opens the path toward the February all-time highs at $59–$60 → RSI-14 advancing toward 70 would validate the renewed momentum phase → The volume profile confirms minimal overhead supply between $54 and $60 — the path of least resistance is higher
- Consolidation at Breakout Level (Constructive Outcome)
Following today's sharp advance, Viavi Solutions Inc. (NASDAQ: VIAV) digests between $50–$54: → Price consolidates above the HVN upper boundary, converting former resistance into support → RSI-14 stabilises in the 58–65 range while EMA-21 rises toward the $52 zone → A tight flag or pennant above the volume profile breakout level would be a high-conviction continuation signal → No thesis damage while price holds above EMA-21 at $49.67
- Mean Reversion Into HVN (Risk Case)
A failure to hold above the $52 upper HVN boundary triggers a pullback into the volume cluster: → Price re-enters the high-volume node zone and faces the full weight of accumulated supply between $44 and $52 → EMA-21 at $49.67 and the POC region near $44–$46 represent the key support levels within the HVN → Provided EMA-50 at $44.25 holds on a closing basis, the broader bull thesis for Viavi Solutions Inc. (NASDAQ: VIAV) remains intact → This remains a secondary scenario while price holds today's gains above $52
Conclusion: Viavi Solutions Inc. (NASDAQ: VIAV) Has Broken Through the Volume Profile's Most Critical Resistance — The Path to All-Time Highs Is Now Open
Viavi Solutions Inc. (NASDAQ: VIAV) has delivered one of the most technically significant sessions in its recent history — an 8.58% surge on 6.47M shares that breaks decisively above the upper boundary of the Fixed Range Volume Profile's high-volume node cluster and enters the low-volume node region where overhead supply is minimal. The confluence of factors supporting this move is exceptional: the FRVP confirms supply has been absorbed, both EMAs are in steep bullish alignment, RSI-14 is advancing from mid-range with significant runway remaining, and today's volume confirms the identity of today's buyers as institutional rather than speculative.
The framework moving forward is clear:
- Above $52.00–$52.50 → HVN breakout confirmed, bullish momentum dominant, target $56 upper profile boundary
- Above $56.00 → volume profile cleared entirely, advance toward $59–$60 all-time highs opens
- Above $60.00 → all-time high breakout, momentum expansion into price discovery territory
- Below EMA-21 at $49.67 → near-term caution, HVN re-entry risk, monitor for distribution
- Below EMA-50 at $44.25 → broader bull thesis under review, structural reassessment required
For momentum traders and network technology investors, Viavi Solutions Inc. (NASDAQ: VIAV) is precisely the kind of chart that demands immediate attention — a volume profile breakout of the highest quality, confirmed by extraordinary institutional volume, with the all-time highs now within striking distance and minimal technical resistance standing in the way.


 Please wait processing your request...