
After months of consolidation and range-bound trading, Vishay Intertechnology (VSH) is now displaying one of the clearest bullish continuation structures in the semiconductor space. The stock has surged from lows near $15 in late 2025 to close at $39.74 (+7.30%), marking a powerful trend expansion supported by rising Volume, strong momentum, and accelerating moving averages. With both the EMA-21 and EMA-50 sloping sharply higher and RSI entering sustained bullish territory, VSH appears to be transitioning from accumulation into a high-momentum breakout phase.
Key Highlights
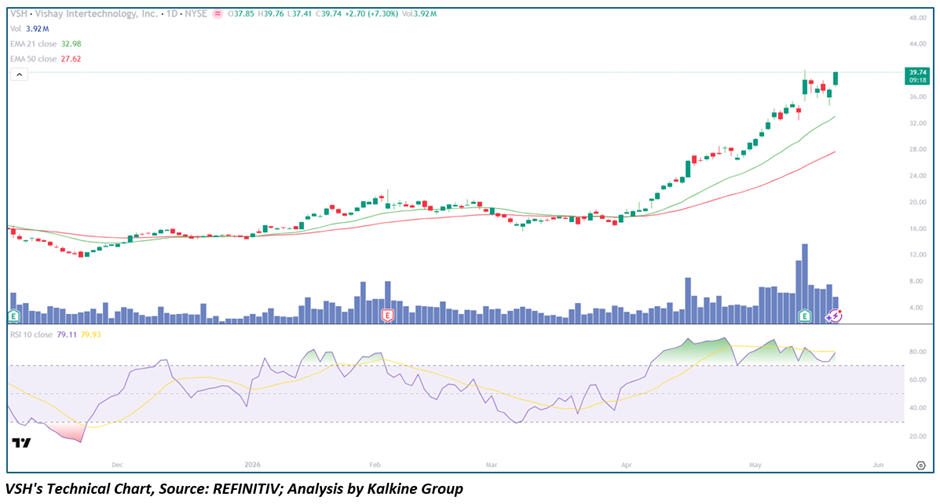
- VSH closed at $39.74, gaining +7.30% on the session after touching an intraday high near $39.76
• Price is trading significantly above both the EMA-21 ($32.98) and EMA-50 ($27.62), confirming strong bullish structure
• The stock has rallied more than 150% from its late-2025 lows near $15
• RSI-10 is elevated at 79.11, reflecting strong momentum and sustained buying pressure
• Volume has expanded sharply during the latest breakout leg, signaling institutional participation
• The chart structure from late 2025 to May 2026 shows a full transition from accumulation to momentum expansion
• Recent consolidation near $36–38 appears to have resolved higher, opening the door toward psychological resistance at $40+
Trend Structure: From Base Formation to Momentum Expansion
Phase 1 — Capitulation & Bottoming (Oct – Nov 2025)
VSH experienced a prolonged decline into late 2025, eventually bottoming near the $12–14 range. During this phase:
- Volume began stabilizing
• Selling momentum slowed significantly
• EMA-21 and EMA-50 flattened out
• RSI entered deeply oversold territory
This marked the early signs of long-term accumulation.
Phase 2 — Early Recovery (Dec 2025 – Jan 2026)
The stock began reclaiming key moving averages as buyers slowly regained control.
Key signals included:
- EMA-21 crossing above EMA-50
• Higher lows beginning to form
• Volume expansion during green candles
• RSI sustaining above 50 for the first time in months
This phase confirmed a structural trend Reversal.
Phase 3 — Consolidation & Institutional Accumulation (Feb – Mar 2026)
After the initial recovery, VSH entered a healthy consolidation zone between roughly $18–22.
This period showed classic bullish characteristics:
- Tight price compression
• Rising moving averages underneath price
• Declining Volatility
• Persistent higher lows
Rather than distribution, the consolidation appeared to be institutional accumulation before the next breakout leg.
Phase 4 — Breakout Expansion (Apr – May 2026)
This is the current phase — and the most technically important.
The breakout above prior resistance triggered an explosive momentum move:
- Price accelerated above $25, then $30, then $35 rapidly
• Volume surged dramatically on breakout candles
• EMA-21 steepened aggressively higher
• RSI entered sustained bullish territory above 70
The recent breakout toward $40 suggests trend acceleration rather than exhaustion at this stage.
Moving Averages: Strong Bullish Alignment
One of the strongest bullish characteristics on the chart is the Moving Average structure.
EMA-21 ($32.98)
- Rising steeply upward
• Acting as immediate dynamic support
• Has consistently supported pullbacks during the rally
EMA-50 ($27.62)
- Trending sharply higher
• Well below current price, confirming medium-term trend strength
• Indicates the rally is broad-based rather than short-lived
The large spread between price and the moving averages reflects powerful momentum, though it also suggests short-term pullbacks may occur as the stock cools off from extended levels.
Momentum Analysis: RSI Signals Powerful Trend Strength
The RSI-10 reading at 79.11 confirms exceptionally strong bullish momentum.
Normally, RSI above 70 can indicate overbought conditions — but during strong momentum trends, elevated RSI often reflects institutional buying strength rather than imminent reversal.
Important context:
- RSI has remained elevated during the latest leg higher
• Momentum has not yet shown bearish divergence
• Pullbacks have remained shallow and quickly bought
This behavior is typical of momentum expansion phases where buyers remain in firm control.
However, traders should monitor:
- RSI divergence
• Failed breakout attempts
• High-volume reversal candles
for early signs of exhaustion.
Volume Analysis: Institutional Participation Appears Strong
Volume behavior strongly supports the bullish case.
Key observations:
- Major breakout candles were accompanied by heavy volume spikes
• Up-volume consistently exceeds down-volume during rallies
• Recent consolidation retained elevated participation
This suggests:
- Strong institutional accumulation
• Momentum-driven inflows
• Growing market attention toward the stock
Importantly, there are currently few signs of panic distribution.
Key Technical Levels
Resistance Levels
- $40 — immediate psychological resistance
• $42–44 — breakout extension zone
• $48–50 — long-term expansion target
Support Levels
- $36–37 — near-term breakout support
• EMA-21 at $32.98 — primary dynamic support
• EMA-50 at $27.62 — major structural support
• $25 zone — prior breakout base
Scenario Analysis
- Bullish Continuation (Primary Case)
If VSH sustains above $36–37 and clears $40 decisively:
→ Momentum expansion could continue toward $45–50
→ RSI may remain elevated during trend acceleration
→ EMA-21 likely continues acting as buy-the-dip support
- Healthy Consolidation (Secondary Case)
After a vertical rally, the stock may pause:
→ Range between $35–40
→ RSI cools gradually
→ EMAs catch up underneath price
This would strengthen the long-term bullish structure.
- Bearish Reversal (Risk Case)
A breakdown below EMA-21 with heavy volume would weaken momentum:
→ First downside target: EMA-50 near $27–28
→ Loss of EMA-50 would signal deeper correction risk
Currently, this remains the lower-probability scenario.
Conclusion: A High-Momentum Semiconductor Breakout
Vishay Intertechnology has transitioned from a quiet recovery candidate into a full-fledged momentum breakout stock.
The technical picture is now defined by:
- Strong bullish moving average alignment
• Sustained high RSI momentum
• Heavy breakout volume
• Higher highs and higher lows
• Institutional-style accumulation behavior
The key framework is now straightforward:
- Above $36–37 → bullish momentum remains intact
• Above $40 → breakout acceleration likely
• Below EMA-21 → caution increases
At the current stage, VSH appears firmly in bullish expansion mode, with momentum traders and trend-followers likely to remain active as long as the stock continues holding above its rising support structure.


 Please wait processing your request...