
 CA
 NZ
 UK
 AU
 IND

 US

 Share
 X (Formerly Twitter)
 Whatsapp
 Facebook
 LinkedIn
 Telegram
 Email This Article
 Copy Link
 Summarize with AI
 Chat GPT
 Perplexity

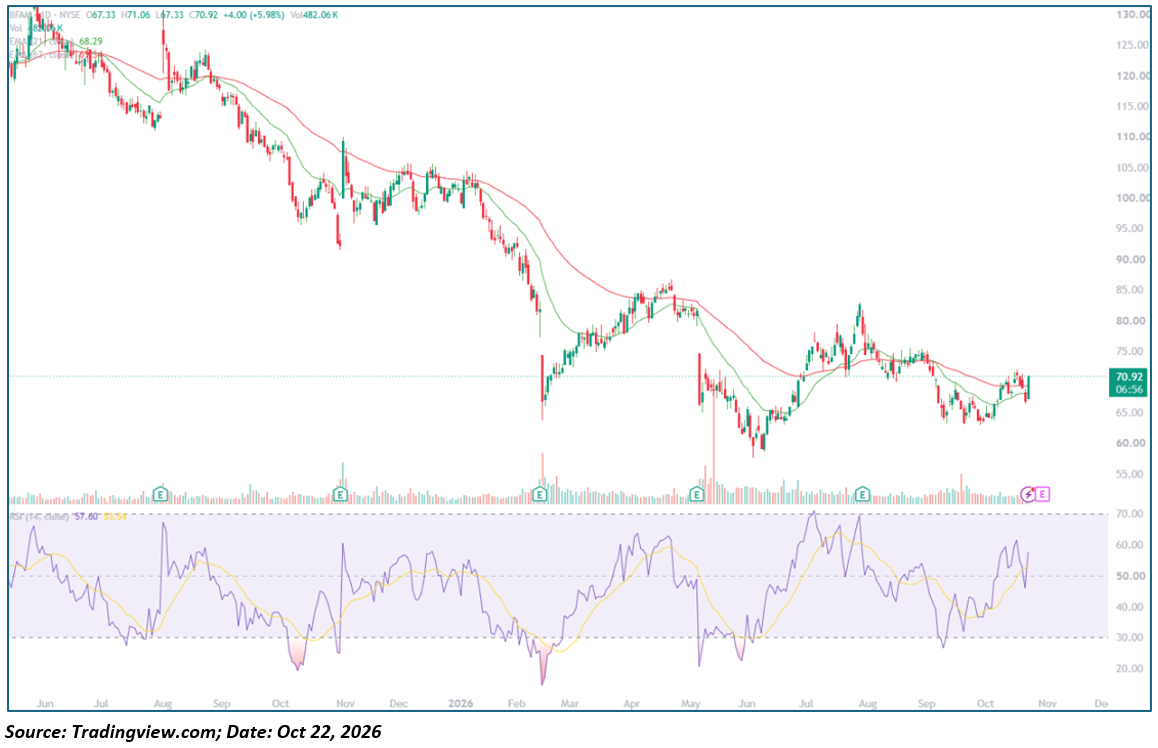
Bright Horizons Family Solutions Inc. (NYSE: BFAM) is staging a strong technical rebound after printing a decisive bullish expansion candle that reclaims both its short- and medium-term dynamic averages. As of this chart snapshot (about 7 minutes before the close on October 22, 2026), shares trade at $70.92, up $4.00 (+5.98%). The stock opened at $67.33 (which also marked the intraday session low), reached a peak of $71.06, and closed virtually at the top of its session range. The move marks an aggressive recovery from the mid-September/early-October double-bottom consolidation near $64.00, pushing the price back above the 21-day and 63-day exponential moving averages. An Earnings marker ("E") appears at the far right of the timeline, suggesting quarterly fundamental earnings developments or imminent reporting catalyst.
Key Highlights
- Trading at $70.92, up $4.00 (+5.98%), on partial-session Volume of 482.06K shares.
- Opened at $67.33, which served as the session low, and reached an intraday high of $71.06, closing with virtually no upper wick.
- 21-day EMA is roughly $68.29 and 63-day EMA is roughly $69.84, with the closing print lifting shares above both dynamic levels.
- 14-day RSI is at 57.60, rebounding above its 53.54 signal line and reclaiming constructive territory above the 50 neutral midpoint.
- Prior resistance sits at ~$74.00–$75.00, with secondary swing resistance at ~$82.00; support is at $68.29–$69.84 (reclaimed EMA cluster), $67.33 (session low), and ~$64.00 (October base floor).
Trend Structure: Four-Act Pattern
- Top Distribution and Cyclical Breakdown (June – October 2025):
BFAM traded in a wide distribution range between $115.00 and $130.00 during mid-2025, carving out a cyclical peak near $130.00 in June. Following consecutive earnings markers in August and November, the stock failed to maintain support, embarking on a prolonged downtrend beneath its declining moving averages.
- Accelerated Capitulation and February Flush (November 2025 – February 2026):
Selling pressure steepened heading into early 2026 as shares broke beneath psychological support levels. A heavy-volume post-earnings capitulation in February forced a flash drop toward $66.00, sending the 14-day RSI into deeply oversold territory below 20.
- Spring Rebound and Summer W-Bottom (March – July 2026):
From the February trough, the stock mounted a recovery leg to test $85.00 in April before an earnings gap-down in May drove shares back down to establish a major capitulation floor near $60.00 in June. The stock quickly rebounded through July, advancing to an interim high near $83.00 with RSI reaching overbought levels near 70.
- Autumn Base Formation and EMA Breakout (August – October 2026):
Following an August earnings gap-down from $83.00, BFAM settled into a consolidation shelf between $64.00 and $74.00. A secondary test of $64.00 in late September/early October found firm buyer demand, setting up the October 22 expansion candle that cleared both EMAs and lifted RSI back toward 58.
Backdrop
Volume throughout the late-summer consolidation remained relatively light, with the largest turnover spikes clustered around the May and August earnings events. Today's volume of 482.06K shares shows expanding interest on the advance. The "E" markers along the timeline highlight quarterly reports in August and November 2025, and February, May, and August 2026. The earnings ICON marked directly adjacent to the current candle indicates that corporate results and guidance are once again acting as the primary catalysts for volatility.
Moving Averages and Momentum Profile
- Candle Dynamics: Today's candle opened at $67.33, held that price as the absolute intraday floor, and drove steadily into the close at $70.92 (high of $71.06). The large green candle with no lower wick and a negligible upper wick indicates resolute buyer dominance from the opening bell to the close.
- Moving Average Stack: The 21-day EMA ($68.29) remains slightly beneath the 63-day EMA ($69.84), but today's close clears both averages simultaneously. Sustaining above the 63-day EMA is the required condition to trigger a bullish EMA crossover in upcoming sessions.
- Oscillator Behavior: The 14-day RSI prints at 57.60, curling upward and crossing above its 53.54 signal line. Reclaiming the positive momentum zone (>50) leaves ample runway before approaching overbought thresholds (>70).
- Volume Behavior: Turnout of 482.06K shares represents a solid pickup over the quiet drift seen in early October. Expanding beyond 600K+ shares on follow-through days would confirm institutional sponsorship.
Key Technical Levels
|
Level |
Type |
Note |
|---|---|---|
|
~$83.00–$85.00 |
Resistance |
Summer swing peaks from April and August 2026 |
|
~$74.00–$75.00 |
Resistance |
Horizontal distribution shelf and breakdown point from late August |
|
$71.06 |
Resistance |
Session intraday high |
|
$70.92 |
Reference |
Current market price |
|
$69.84 |
Support |
Dynamic 63-day EMA |
|
$68.29 |
Support |
Dynamic 21-day EMA |
|
$67.33 |
Support |
Session low / open |
|
~$64.00 |
Major Support |
Multi-month double-bottom base (September–October lows) |
|
~$60.00 |
Major Support |
Summer cycle capitulation low (June 2026) |
Actionable Technical Outlook
- Bullish Scenario: A sustained daily close above the 63-day EMA ($69.84) validates the breakout, opening a direct technical path toward the horizontal resistance shelf at $74.00–$75.00. A breakout through $75.00 would clear room toward the summer highs near $83.00.
- Pullback Scenario: Given the sharp single-day move (+5.98%), a shallow retest of the reclaimed moving-average zone between $68.29 and $69.84 is common. If buyers defend this zone as new support, it would establish a strong higher-low launchpad.
- Bearish / Invalidation Scenario: A daily close back below $67.33 would erase the day's breakout momentum, while a break beneath $64.00 would invalidate the intermediate recovery structure and expose the June macro low near $60.00.
Metadata
|
Field |
Value |
|---|---|
|
Headline |
Why is Bright Horizons (NYSE: BFAM) Surging 5.98% to $70.92 on an EMA Reclaim, and Can It Hold Above $68.50? |
|
SEO title |
Bright Horizons (BFAM) Stock Surges 6%: EMA Reclaim, RSI 58, and $74 Resistance Target |
|
Meta description |
Bright Horizons (NYSE: BFAM) gains 5.98% to $70.92, reclaiming key 21-day and 63-day EMAs. Technical breakdown covering support levels, RSI momentum, and $74 target. |
|
Slug |
why-bright-horizons-bfam-stock-surging-ema-reclaim-68-support-74-level |
|
Tags |
Bright Horizons, BFAM, NYSE, education services, child care, technical analysis, moving averages, RSI, earnings |
|
Ticker / Sector |
BFAM / Consumer Discretionary |
|
Verification status |
PARTIAL (levels read directly from TradingView chart snapshot; corporate earnings filings and dates require separate company verification) |
|
Data as-of date |
October 22, 2026 (intraday; snapshot taken approximately 7 minutes before the US market close) |


 Nov 19, 2026





 Please wait processing your request...