
 CA
 NZ
 UK
 AU
 IND

 US

 Share
 X (Formerly Twitter)
 Whatsapp
 Facebook
 LinkedIn
 Telegram
 Email This Article
 Copy Link
 Summarize with AI
 Chat GPT
 Perplexity

Check Point Software Technologies Ltd. (NASDAQ: CHKP) is staging a powerful multi-month breakout after Gapping up through multi-month range resistance. As of this chart snapshot (about 7 minutes before the close), shares are trading at $152.22, up $8.79 (+6.13%). The stock opened with an upside gap at $145.07 (well above the prior session close near $143.43), printed a session low of $145.00, and rallied steadily to a fresh multi-month peak of $152.23. The move represents an aggressive technical breakout from a five-month base between $125.00 and $142.00, pushing the price to its highest level since April 2026. With an Earnings release ICON marked on the day's candle, the expansion appears catalyzed by quarterly fundamental results and subsequent short-covering. 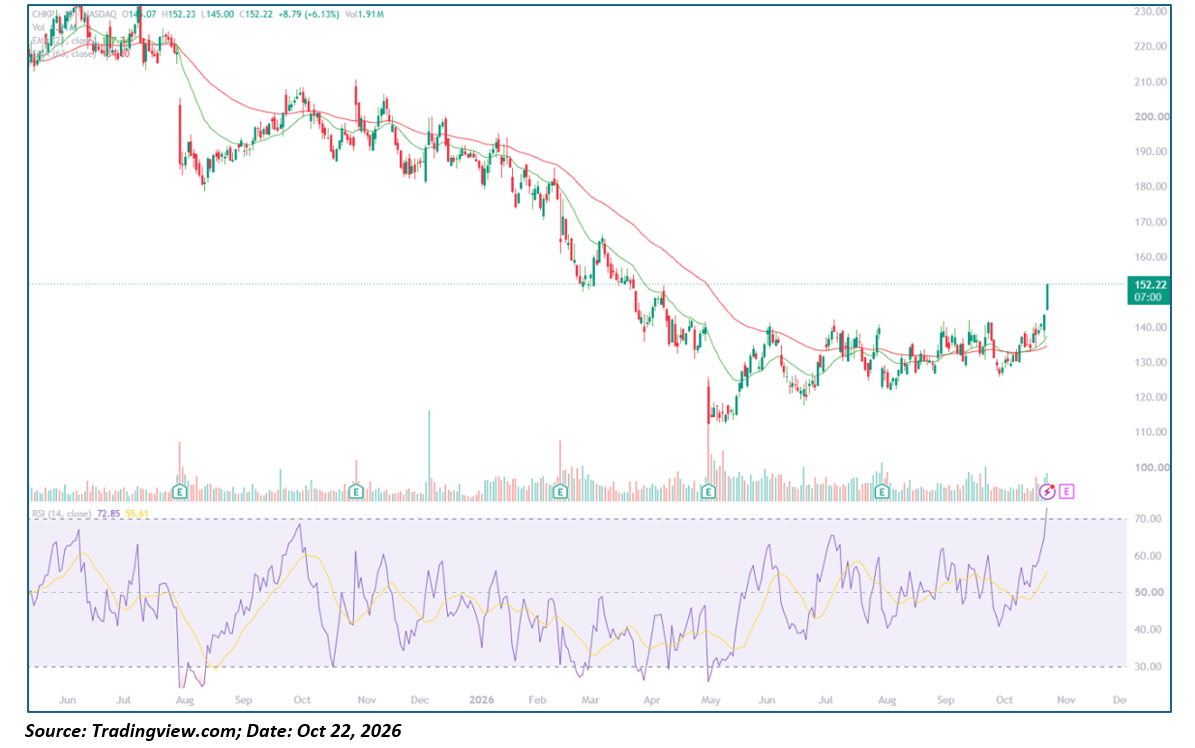
Key Highlights
- Trading at $152.22, up $8.79 (+6.13%), on partial-session Volume of 1.91M shares.
- Opened at $145.07, low of $145.00, high of $152.23, with price closing virtually on the high of the day.
- 21-day EMA is roughly $137.34 and 63-day EMA is roughly $134.60 (labels clustered at the top left of the chart), with both sloping upward beneath price.
- 14-day RSI is 72.85, crossing decisively above its 55.61 signal line and entering overbought territory (>70).
- Prior resistance sits at ~$142.00–$143.00, with major overhead targets at ~$155.00 and ~$165.00; support is at $145.00 (gap floor/session low), the prior breakout ceiling near $142.00, and the rising EMAs near $137.34 and $134.60.
Trend Structure: Four-Act Pattern
- Top Distribution and Cyclical Peak (June – October 2025):
CHKP traded in an elevated range between $210.00 and $230.00 during mid-2025, printing an all-time peak near $230.00 in August. Following an earnings report in late October, the stock failed to sustain rallies above $210.00, initiating a gradual distribution sequence beneath its dynamic moving averages.
- Downtrend and Capitulation Flush (November 2025 – May 2026):
Selling accelerated through the winter and spring as CHKP formed a sequence of lower highs and lower lows. The stock broke decisively below $180.00 in March and experienced a heavy-volume capitulation sell-off in early May, bottoming at a multi-year low near $110.00 with the RSI dipping below 30.
- Multi-Month Base Building and EMA Absorption (June – September 2026):
From the May trough, the stock staged a sharp rebound to $142.00 in June before settling into a prolonged horizontal channel between $125.00 and $142.00. Through July, August, and September, the 21-day and 63-day EMAs flattened and converged near $134.00–$137.00 as selling pressure subsided.
- Earnings Gap Breakout (October 2026):
After establishing a higher low near $131.00 in early October, CHKP broke out violently with an earnings-driven gap above the $142.00 range boundary. The large green expansion bar cleared the ceiling on expanding volume, sending the 14-day RSI surging to 72.85—its highest reading since 2025.
Backdrop
Volume has been relatively subdued throughout the summer consolidation, with the largest volume spikes occurring during the May capitulation and earlier quarterly reports. The current session's volume of 1.91M shares reflects an uptick in institutional accumulation. The "E" markers across the chart denote quarterly reports in late October 2025, February, May, and July 2026, with the current breakout candle aligning directly with an active earnings marker. Cybersecurity execution, subscription Revenue metrics, and forward guidance should be evaluated alongside the technical breakout.
Moving Averages and Momentum Profile
- Candle Dynamics: Today’s open gapped above the prior day's close and printed an intraday low of $145.00 before surging into the close at $152.22. The wide-range green candle shows virtually no upper wick, confirming that buyers maintained total control into the final minutes of the session.
- Moving Average Stack: The 21-day EMA ($137.34) has widened its spread above the 63-day EMA ($134.60), with both turning upward after months of compression. Price sits roughly 10.8% above the 21-day EMA and 13.1% above the 63-day EMA, highlighting significant short-term extension that may invite eventual retests of the gap.
- Oscillator Behavior: The 14-day RSI sits at 72.85, rising well above its 55.61 signal line. While overbought, momentum thrusts out of prolonged consolidation bases often remain elevated during initial breakout legs.
- Volume Behavior: Volume of 1.91M shares is elevated for a single session and is trending significantly higher than the 30-day average, signaling genuine institutional sponsorship behind the gap.
Key Technical Levels
|
Level |
Type |
Note |
|
~$165.00 |
Resistance |
Breakdown shelf from March 2026 |
|
~$155.00 |
Resistance |
Structural Supply zone from April 2026 |
|
$152.22 |
Reference |
Current price and high of the day |
|
$145.00 |
Support |
Session low and top of the earnings gap |
|
~$142.00–$143.00 |
Support |
Prior five-month horizontal range ceiling |
|
$137.34 |
Support |
Rising 21-day EMA |
|
$134.60 |
Support |
Rising 63-day EMA |
|
~$125.00 |
Major Support |
Summer base floor and swing low |
Historical levels are approximate readings from the supplied daily chart. The 21-day and 63-day EMA values reflect the chart overlay labels.
Actionable Technical Outlook
- Bullish Scenario: Sustained closes above $145.00 keep the breakout structure clean, opening a path toward the next major overhead supply band at $155.00, followed by $165.00. Continued expansion in trading volume would validate the start of a multi-week continuation trend.
- Pullback Scenario: Given that RSI has crossed into overbought territory at 72.85 and price is stretched ~10.8% above the 21-day EMA, an orderly consolidation or pullback toward $145.00–$147.00 is probable. Holding the $142.00–$145.00 prior resistance-turned-support zone would provide a low-risk entry shelf.
- Bearish / Invalidation Scenario: A full gap Fill and daily close back below $142.00 would trap late breakout buyers and place the stock back inside its summer range. A breakdown below the 21-day EMA ($137.34) would neutralize the recovery impulse and point to retesting the $134.60 level.
Metadata
|
Field |
Value |
|
Headline |
Why is Check Point (NASDAQ: CHKP) Surging 6.13% to $152.22 on an Earnings Breakout, and Can It Hold Above $145? |
|
SEO title |
Check Point (CHKP) Stock Surges 6% on Earnings Gap: RSI 73 and $155 Target |
|
Meta description |
Check Point Software (NASDAQ: CHKP) jumps 6.13% to $152.22 on an earnings breakout. Technical Analysis covering the $145 gap floor, EMA stack, and $155 resistance. |
|
Slug |
why-check-point-chkp-stock-surging-earnings-gap-145-support-155-level |
|
Tags |
Check Point Software, CHKP, NASDAQ, cybersecurity, systems software, technical analysis, moving averages, RSI, earnings |
|
Ticker / Sector |
CHKP / Technology |
|
Verification status |
PARTIAL (levels read directly from the TradingView chart snapshot; fundamental earnings metrics require separate company verification) |
|
Data as-of date |
October 22, 2026 (intraday; snapshot taken approximately 7 minutes before the US market close) |


 Nov 13, 2026





 Please wait processing your request...