
 CA
 NZ
 UK
 AU
 IND

 US

 Share
 X (Formerly Twitter)
 Whatsapp
 Facebook
 LinkedIn
 Telegram
 Email This Article
 Copy Link
 Summarize with AI
 Chat GPT
 Perplexity

Sector: Information Technology (AI Cloud Infrastructure)
CoreWeave, Inc. (NASDAQ: CRWV) is extending a breakdown after losing its two-month trading range. As of this chart snapshot (about 56 minutes before the close), shares are trading at $80.27, down $1.81 (-2.21%), on partial-session Volume of 13.65M shares. The stock gapped down from Friday's close near $82.08 to open at $80.33, rose to a high of $80.90 and slid to a low of $79.03, then recovered part of the loss to trade in the middle of its range. The drop follows a heavy-volume red bar on Friday that broke below both EMAs, and price is now near the bottom of the range that has held since mid-August. I could not find a company-specific catalyst, so the case rests on the chart. 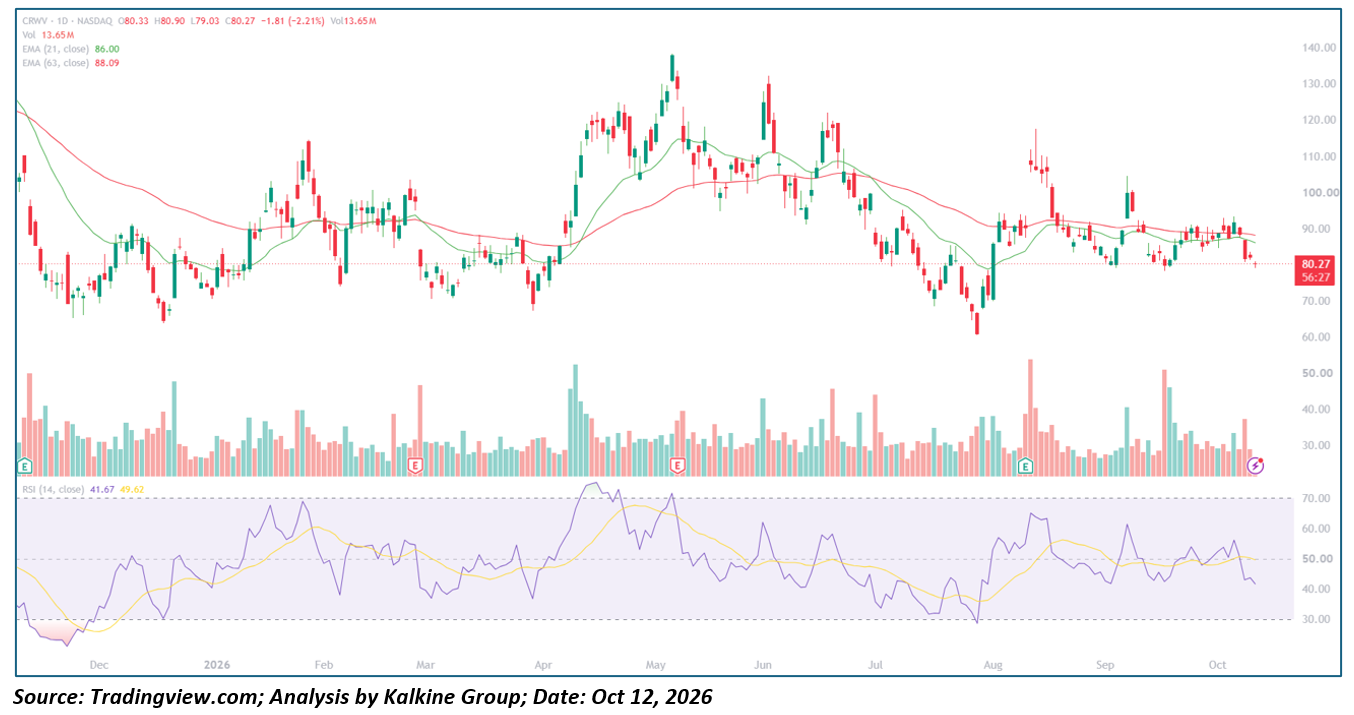
Key Highlights
- Trading at $80.27, down $1.81 (-2.21%), on partial-session volume of 13.65M shares
- Opened at $80.33 (gap down), high of $80.90, low of $79.03
- 21-day EMA at $86.00 and 63-day EMA at $88.09, both above price
- 14-day RSI at 41.67, below its 49.62 signal line and under 50
- Resistance at $86.00 and $88.09; support at $79.03 and the mid-September low near $78
Trend Structure: Three-Act Pattern
- Collapse and Range (November 2025 – March 2026): CRWV fell from about $125 in early November to a low near $64 around the early-December lows, where RSI dropped to about 22, an oversold reading. It then rallied to about $114 in late January and ranged between roughly $72 and $104 through March.
- Spike and Reversal (April – July 2026): A dip to about $67 in early April marked the low. The stock then surged to a peak near $138 in early May, with RSI near 76, and reversed. It made lower highs near $132 and $122 in June and slid to a low near $61 in late July, about 56% below the May high. RSI fell to about 29, close to oversold.
- Bounce and Range (August – October 2026): A rebound after the August Earnings report lifted the stock to about $117 in mid-August, but the rally faded within days. The stock then ranged between about $78 and $105 through September and early October, with repeated rejections at the 63-day EMA near $90. Friday's drop broke below both EMAs. The stock is about 42% below the May high and still about 32% above the July low.
Backdrop
The next quarterly earnings report is typically due in mid-November, so confirm the date. The earnings markers on the chart line up with some of the largest moves, including the January rally, the May peak and the August bounce. The report is likely the next large catalyst, and the stock has reacted sharply to past releases. Memory and storage names (MU, SNDK) are also falling in the same session, so check for AI-infrastructure news that may explain the weakness.
Moving Averages and Momentum Profile
- Moving Average Stack: The 21-day EMA ($86.00) is below the 63-day EMA ($88.09), and both are falling. That is a bearish stack, though the gap is only about 2%. Price is about 6.7% below the 21-day and 8.9% below the 63-day, so both act as overhead resistance. The averages have been bunched together since August, which fits a range rather than a strong trend.
- Candle Behavior: Today's candle is a small red bar that gapped down and then recovered part of the loss, leaving a small lower wick. It follows Friday's large red bar on rising volume, so today looks like a pause rather than a fresh wave of selling.
- Oscillator Behavior: RSI at 41.67 has fallen from about 56 in early October and crossed below its signal line at 49.62. It has held between about 40 and 60 since August, so a drop toward 30 would be a break from that range.
- Volume Behavior: Volume of 13.65M is partial, with the session still open. It is well below Friday's spike and the heavy surges in early September and August, so a close on rising volume below $78 would give a breakdown more weight.
Key Technical Levels
|
Level |
Type |
Note |
|
$138 |
Resistance |
Early-May cycle high (approximate) |
|
$105 |
Resistance |
Early-September spike high (approximate) |
|
$93 |
Resistance |
Early-October swing high (approximate) |
|
$88.09 |
Resistance |
63-day EMA |
|
$86.00 |
Resistance |
21-day EMA |
|
$82.08 |
Resistance |
Friday's close, top of the gap (derived from today's change) |
|
$80.27 |
Reference |
Current price |
|
$79.03 |
Support |
Today's low |
|
$78 |
Support |
Mid-September swing low (approximate) |
|
$61 |
Support |
Late-July cycle low (approximate) |
Actionable Technical Outlook
- A close below today's low at $79 and the mid-September low near $78 would break the bottom of the range that has held since mid-August. That would put the $70 area in play, with the $61 July low as the next major reference, since the chart shows few touches between them.
- A close back above the 21-day EMA near $86 would take pressure off, and a move through the 63-day EMA near $88 would signal that Friday's break failed. Until then, rallies toward $82 to $86 are likely to meet sellers.
- RSI is below 50 and both EMAs are falling, but the stock has held the $78 area twice since August. A retest of $78 to $80 is likely before any sustained move, and a bounce from there would need to clear $86 to change the picture. This is a technical read, not Investment advice.
Metadata
|
Field |
Value |
|
Headline |
Why is CoreWeave (NASDAQ: CRWV) sliding 2.2% to $80.27 below both EMAs, and can it hold the September low near $78? |
|
SEO title |
CoreWeave (CRWV) Falls 2.2% to $80.27: EMA Resistance and $78 Support |
|
Meta description |
CoreWeave (NASDAQ: CRWV) drops 2.2% to $80.27 below its 21- and 63-day EMAs. RSI 42, key support and resistance levels for traders. |
|
Slug |
why-coreweave-crwv-nasdaq-stock-slides-below-emas-78-support |
|
Tags |
CoreWeave, CRWV, NASDAQ, AI cloud, technical analysis, moving averages, gap down |
|
Ticker / Sector |
CRWV / Information Technology |
|
Verification status |
PARTIAL (levels read from the chart; catalyst not confirmed) |
|
Data as-of date |
October 12, 2026 (intraday; chart snapshot taken October 13 at 00:33 IST, about 56 minutes before the US close) |


 Nov 13, 2026





 Please wait processing your request...